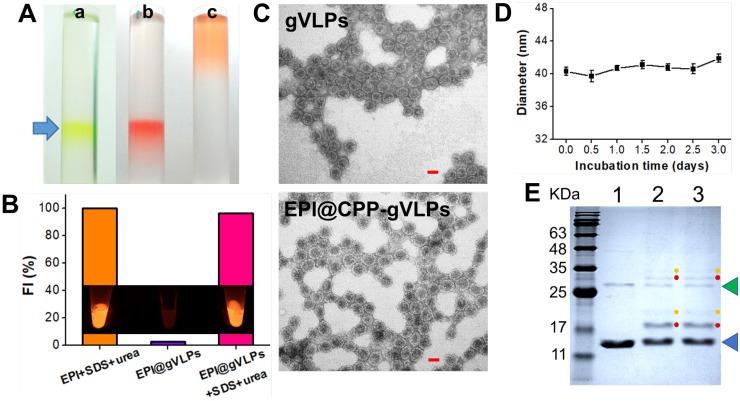
Figure 2.
(A) White light photographs of ultracentrifuge tubes with sucrose density gradient ultracentrifugation to concentrate and partially purify (a) CPP-gVLPs (green color), (b) EPI@CPP-gVLPs (red color), and (c) free EPI (orange color). (B) Fluorescence intensities of EPI+SDS+Urea, EPI@gVLPs, and EPI@gVLPs+SDS+Urea under excitation at 480 nm; the SDS (10%) and Urea (8 M) were added for protein and RNAs were denatured to simulate EPI release from CPP-gVLPs in U87-MG cells (inset: fluorescence images for each sample). (C) Transmission electron microscope images of gVLPs (top) and EPI@CPP-gVLPs (bottom) (scale bar = 20 nm). (D) Serum stability of EPI@CPP-gVLPs after incubation in mouse blood serum for 3 days; values are expressed as means ± SD (n = 3). (E) Characterization of purified gVLPs (lane 1), CPP-gVLPs (lane 2), and EPI@CPP-gVLPs (lane 3) by 15% SDS-PAGE. The molecular weight of QβCP monomer is 14.4 kDa (blue arrow) and QβCP dimer is 28.8 kDa (green arrow). Red dots: QβCP conjugated with single CPP. Yellow dots: QβCP conjugated with two CPPs.

