Figure 3.
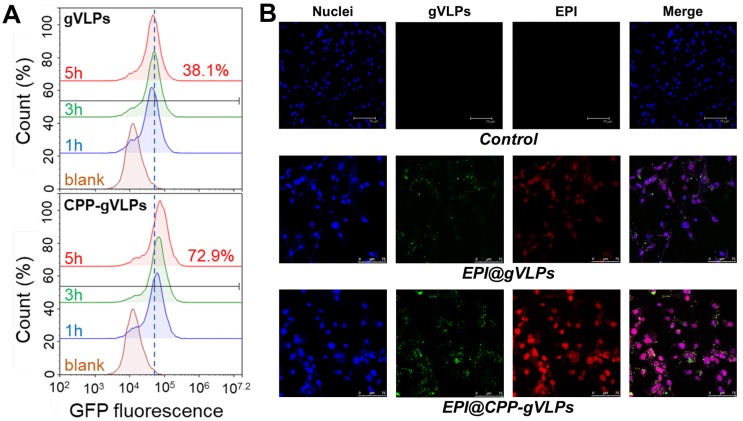
(A) Flow cytometry analysis was performed to quantify the cellular uptake efficiency of gVLPs or CPP-gVLPs in U87-MG cells. The data are shown as histograms of the GFP-channel (auto fluorescence of the gVLPs) with the analysis of the Y mean fluorescence and the percentage of positive cells. (B) The cellular uptake of EPI@gVLPs (top) and EPI@CPP-gVLPs (bottom) in U87-MG cells using fluorescence microscopy analysis. U87-MG cells were incubated with 1.8 mg/mL EPI@gVLPs or EPI@CPP-gVLPs containing 0.5 mg/mL EPI for a period of 24 h in 0.2 mL of culture medium. Scale bar = 75 µm. Green color indicates gVLPs and red color indicates EPI; nuclei were stained blue with Hochest 33342.

