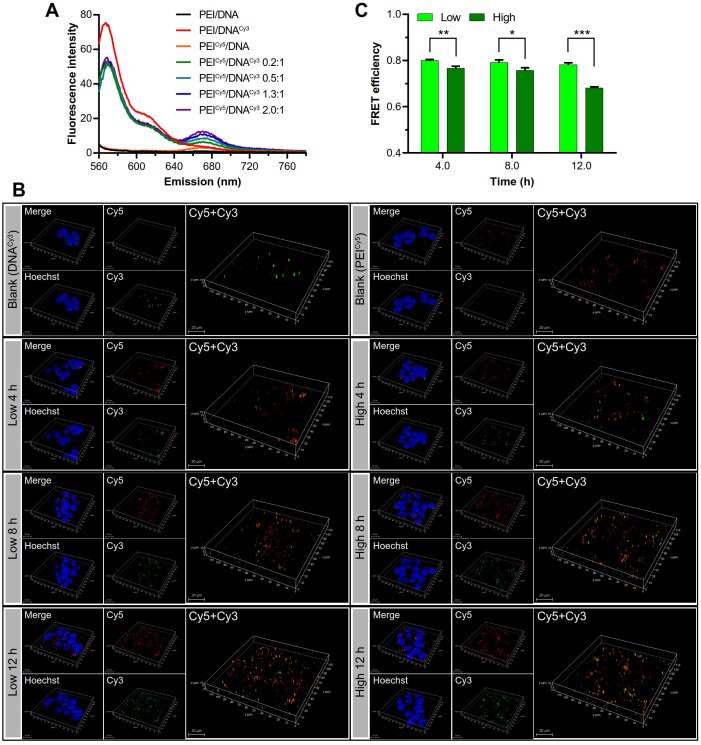
Figure 9.
Observation of the disassociation of DNA and PEI by FRET. (A) The FRET effect was present in the PEICy5/DNACy3 in varying mass ratios. (B) The 3D confocal images of the disassociation of the two groups of NPs in the cell at 4, 8, and 12 h. PEI was shown in red, DNA was shown in green, the cell nuclei were shown in blue, and the co-localization of PEI and DNA was shown in yellow. Scale bar, 20 μm. (C) Quantitative analysis of the FRET efficiency.

