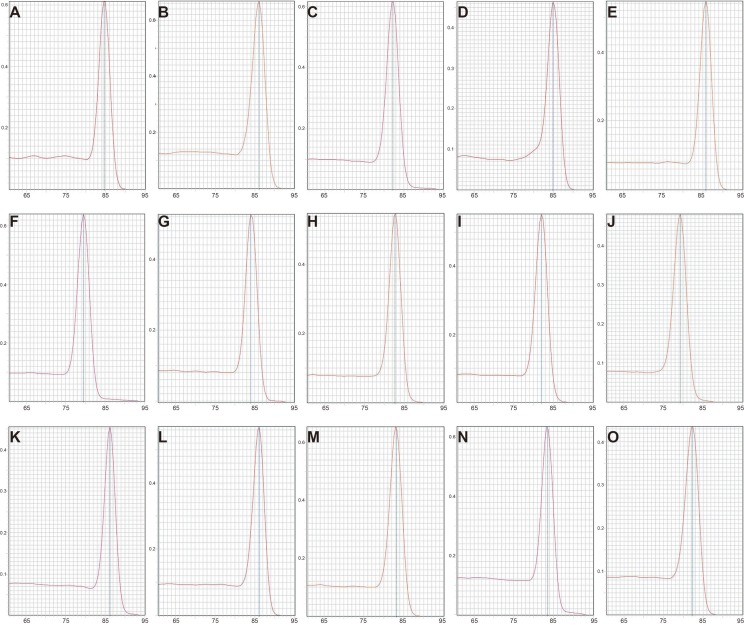
Figure 1. Melting curves of 15 candidate reference genes in RT-qPCR.
(A) Rps18, (B) Actb, (C) B2m, (D) Gapdh, (E) Ppia, (F) Hprt1, (G) Pgk1, (H) Ywhaz, (I) Tbp, (J) Ubc, (K) Rps16, (L) Rpl13a, (M) Rplp1, (N) Sdha, (O) Hmbs. The x axis represents temperature and the y axis represents derivative reporter derived from ABI 7500 detection system. RT-qPCR was performed for nine biological replications in each group.

