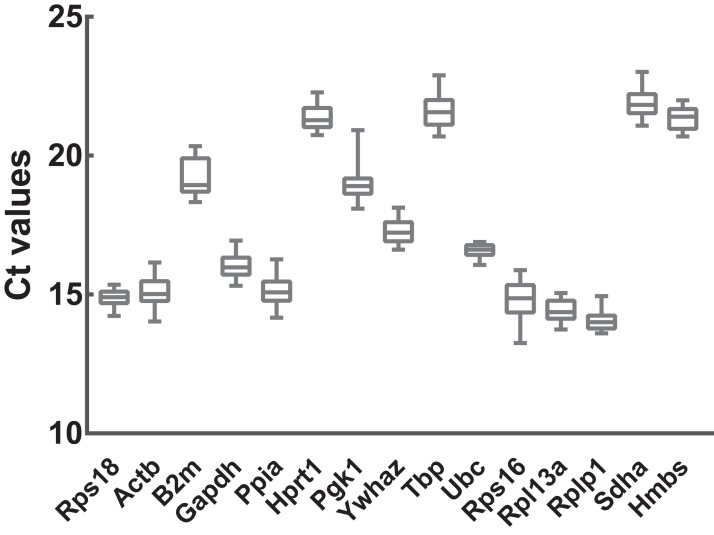
Figure 2. Transcript abundances of 15 candidate reference genes.
Box and whiskers diagram shows the minimum, first quartile, median, third quartile, and maximum of Ct values from the bottom up. A total of 15 candidate reference genes are listed below x axis. Ct values were calculated from nine biological replications in each group.

