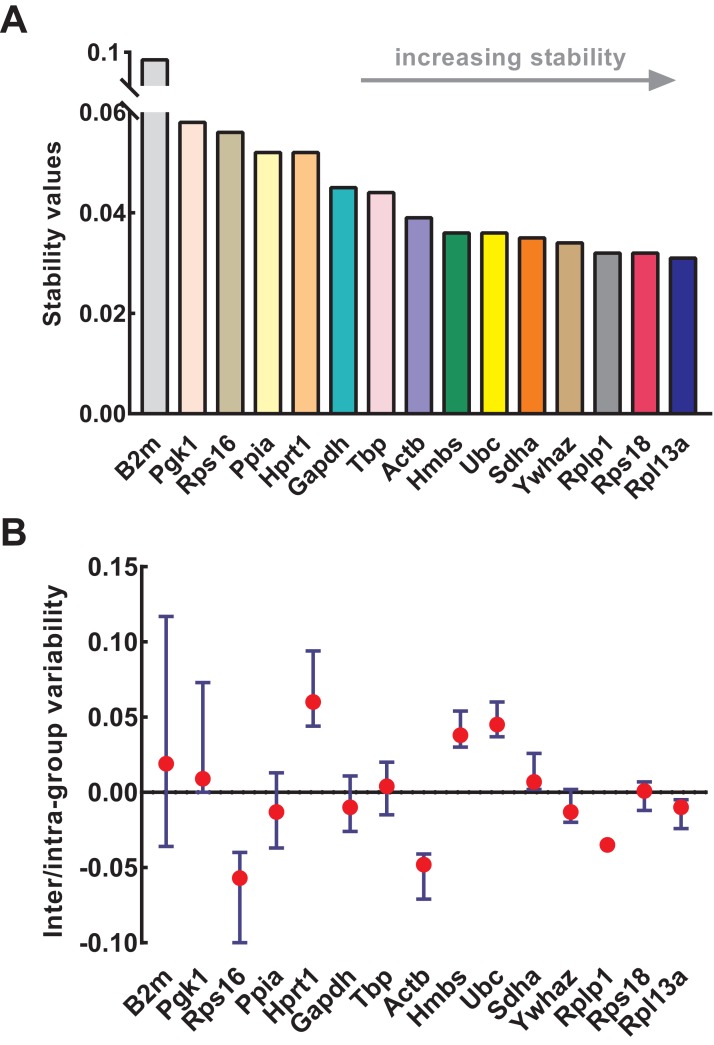
Figure 4. Stability of 15 candidate reference genes analyzed by NormFinder.
(A) Expression stability values of reference genes. From left to right, reference genes are ranked according to increasing stability, ending with most stable gene pairs. (B) The intra- and inter-group variability. Error bars and red dots represent the intra- and inter-group variability, respectively. Input Ct values were calculated from nine biological replications in each group.

