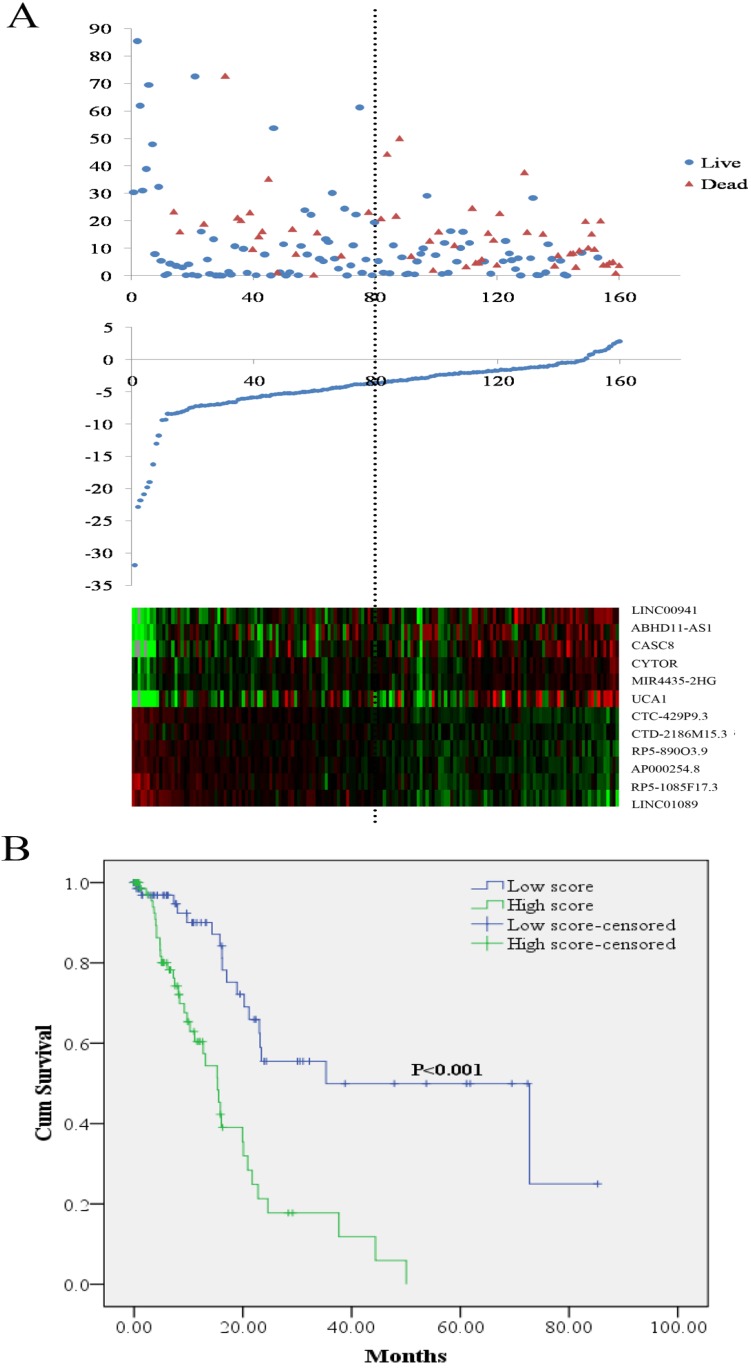
Figure 1.
LncRNA risk score analysis and outcome in PCa patients. (A) Patient survival status and duration (Top; y axis: survival time; x axis: patient id sorted by risk score); risk score (y axis) of the 12 lncRNAs in PCa patients (Middle; x axis: patient id sorted by risk score); heatmap of the 12 lncRNAs expression in PCa patients (Bottom). (B) Kaplan-Meier curve for the low score and high score group. PCa: pancreatic adenocarcinoma

