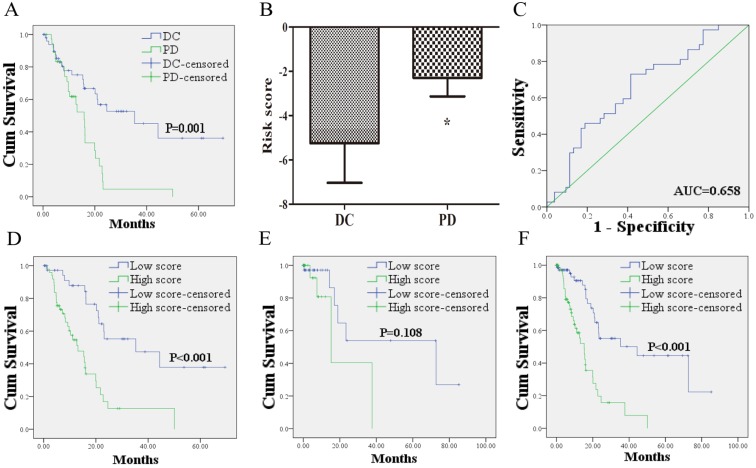
Figure 2.
The relationship between the lncRNA signature risk score and treatment outcome. (A): 53 PCa patients who acquired DC after treatment of first course suffered better OS than the 37 patients with PD. (B) risk score of PCa patients in DC group was lower than those in PD group. (C) ROC curve analysis of the risk score to discriminate patients with DC from those with PD. (D) 49 PCa patients with risk score higher than the cutoff value exhibited worse OS than the 41 cases lower than the score. (E) Kaplan-Meier curve for patients without information of treatment outcome. (F) Kaplan-Meier curve for the 160 patients form the entire dataset with the same cutoff value. DC: disease control; PD: progressive disease; OS: overall survival; ROC: receiver-operating characteristic.

