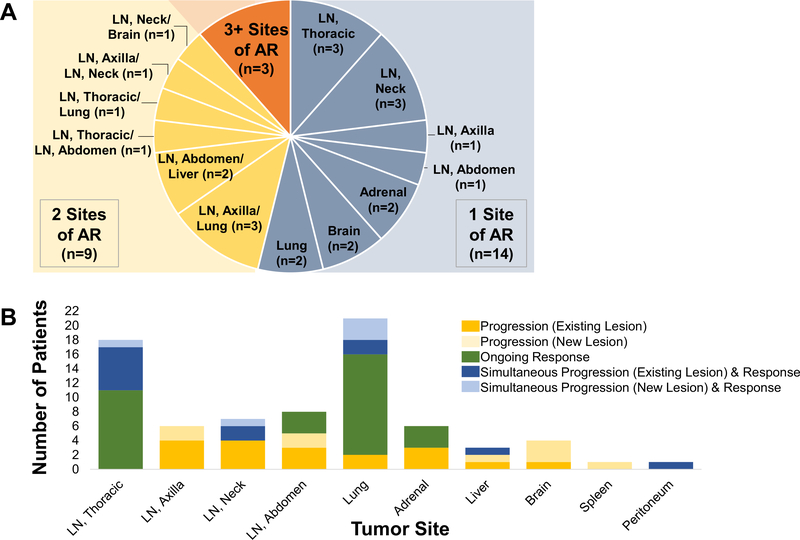
Figure 3.
Sites of AR. (A) Pie chart showing number of patients with one site (grey), 2 sites (yellow), or three or more sites (orange) of progressive disease. Site location provided for patients with progression limited to one or two sites. (B) Progression and ongoing response at time of AR by tumor site. Bar graph showing both sites of tumor growth and sustained tumor response at the time of AR to PD-1 axis inhibitor therapy. Thirteen patients had both progressing and responding lesions in the same organ site at the time of AR. AR, acquired resistance to PD-1 axis inhibitor therapy; LN, lymph node; PD-1, programmed death 1.

