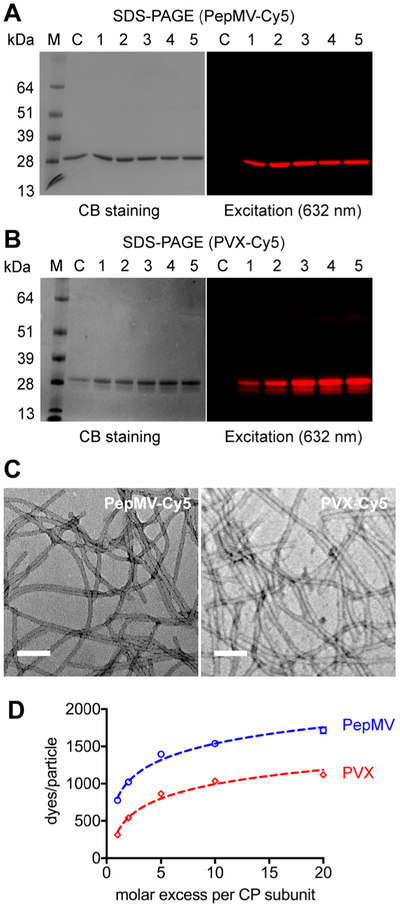
Figure 3.
Characterization of fluorescence-labeled PepMV-Cy5 and PVX-Cy5. SDS-PAGE analysis of (A) PepMV-Cy5 and (B) PVX-Cy5 at increasing molar excesses of sulfo-Cy5-NHS in the reaction mixtures. (1–5) CP/dye molar ratio: 1:1, 1:2, 1:5, 1:10, 1:20, C/nonlabeled particles as controls. (C) The filamentous structures of PepMV-Cy5 and PVX-Cy5 after modification and purification. Scale bars = 100 nm. (D) The number of attached Cy5 molecules per particle (PepMV or PVX) as a function of the molar excess of dye. Experiments were carried out in triplicate, values are shown as means ± SD. Error bars are not displayed when their length is smaller than the marker sizes.

