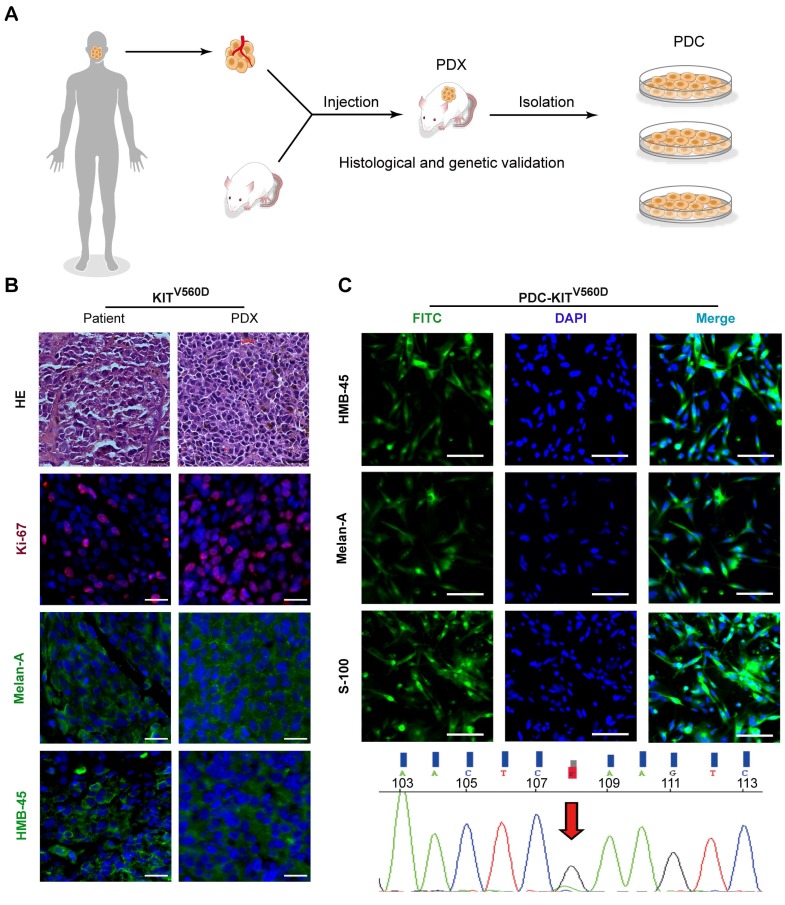
Figure 1.
Establishment and characterization of KITV560D PDX models. (A) Schematic of PDX and PDC establishment. (B) Representative hematoxylin and eosin (H&E) staining and immunofluorescence staining of patient tumors and corresponding PDX model tumors. HMB-45 and Melan-A (both green), Ki-67 (red) and DAPI (blue). The scale bar is 100 μm. (C) Representative immunofluorescence staining of patient-derived tumor cells from KITV560D mutant melanoma PDX models are shown in the upper panel, and the KIT mutation status of the corresponding PDX-derived cells is shown in the bottom panel. HMB-45, Melan-A and S-100 (both green), and DAPI (blue). The scale bar is 100 μm.

