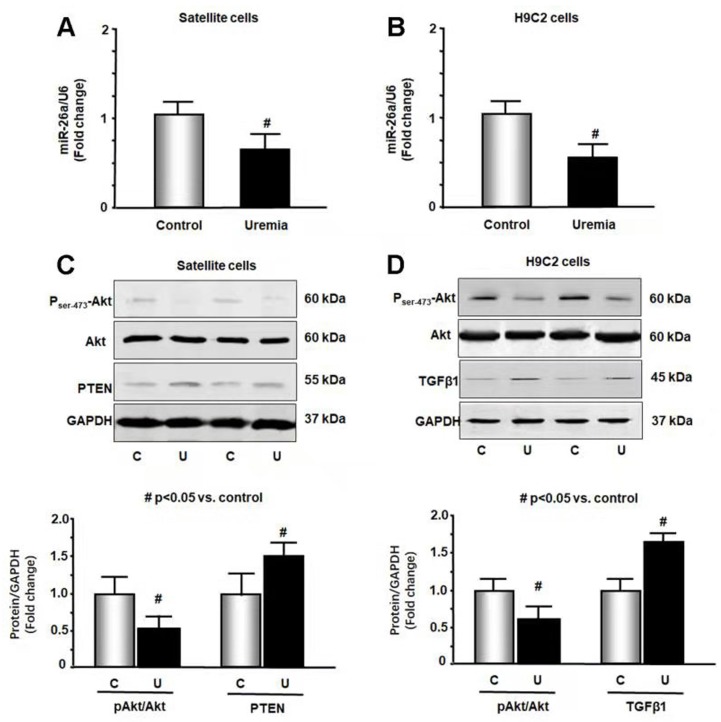
Figure 2.
Exosome-carried mediator induces insulin resistance in skeletal and cardiac muscle cells. Cultured skeletal muscle satellite cells or cardiac H9C2 cells were treated with media containing 5% sham mouse serum (control) or 5% CKD mouse serum (uremia) for 24 hours. (A) Total RNA was extracted from satellite cells. The expression of miR-26a-5p in cells was assayed by real time qPCR. The bar graph shows miR-26a-5p from the uremic serum treatment group compared with the level in the control serum treatment group (represented by 1-fold). The results are normalized to U6 (Bars: mean ± se; n=8/group; #p<0.05 vs. control serum). (B) Total RNA was extracted from cardiac H9C2 cells. The expression of miR-26a-5p in cells was assayed by real time qPCR. The bar graph shows miR-26a-5p from the uremic treatment group compared with the levels in the control serum treatment group (represented by 1-fold). The results are normalized to U6 (Bars: mean ± se; n=8/group; #p<0.05 vs. control serum). (C) Protein was isolated from satellite cells. PTEN and Akt in cell lysates were measured by western blots from different groups of cells. The bar graph shows the fold change of each protein band compared with levels in control serum treatment group represented by 1-fold. (Bars: mean ± se; n = 8/group; #p<0.05 vs. control serum). (D) Protein was isolated from H9C2 cells. TGFβ1 and Akt in cell lysates were measured by western blots. The bar graph shows the fold change of each protein band compared with levels in control serum treatment group represented by 1-fold. (Bars: mean ± se; n = 8/group; #p<0.05 vs. control).

