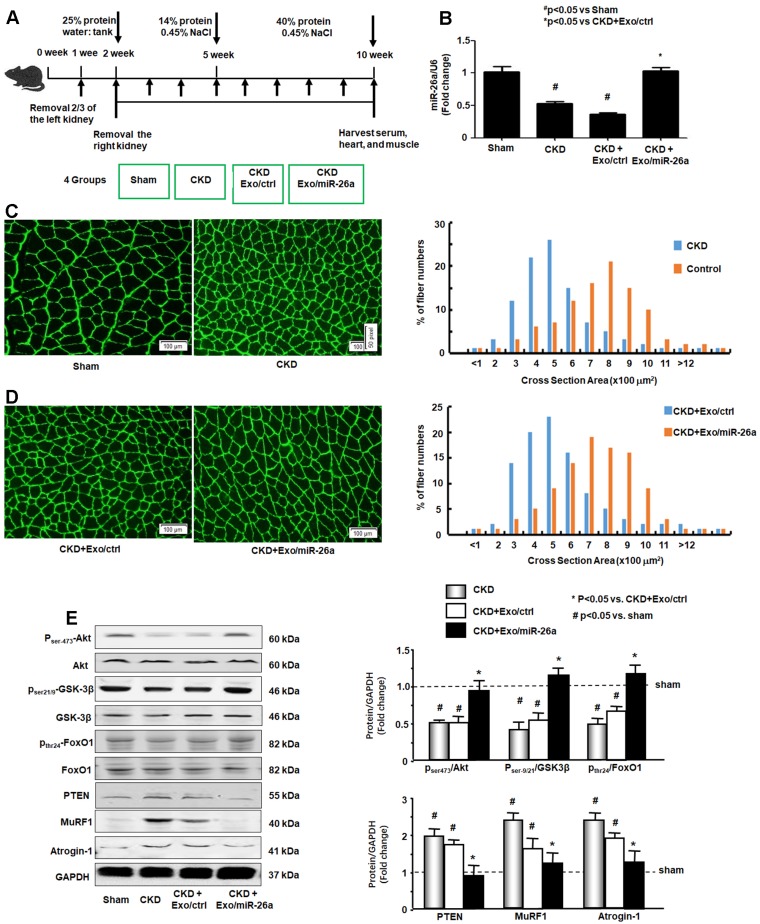
Figure 3.
Provision of miR-26a-5p in skeletal muscle attenuated CKD-induced muscle atrophy. (A) Experiment procedure: Mice were divided into 4 groups: sham, CKD without exosome treatment, CKD with intramuscular injection of exosome-encapsulated microRNA control (Exo/ctrl) and CKD with intramuscular injection of exosome-encapsulated miR-26a (Exo/miR-26a) mice, once per week. (B) Total RNA was isolated from TA muscle of sham, CKD, CKD plus Exo/ctrl and CKD plus Exo/miR-26a (Exo/miR-26a) mice. The expression of miR-26a-5p in muscle was assayed by real time qPCR. The bar graph shows the expression levels of the three miR-26a in each group compared with levels in the sham mice (represented by 1-fold). The results are normalized to U6. (Bars: mean ± se; n=9/group; #p<0.05 vs. sham and *p<0.05 vs. CKD+Exo/ctrl). (C) The representative cross-sectional area of TA muscle of sham and CKD mice. Cryosections of TA muscles were immunostained with anti-laminin antibody. The bar graph shows the frequency distribution of fiber cross-sectional areas (µm2) in sham (orange) and CKD (blue) mice (n=6/group). (D) The representative cross-sectional area of TA muscle of CKD plus Exo/ctrl and CKD plus Exo/miR-26a (Exo/miR-26a) mice. The bar graph shows the frequency distribution of fiber cross-sectional areas in CKD plus Exo/Ctrl (blue) and CKD with Exo/miR-26a (orange) mice (n=6/group). (E) Akt, p-Akt, GSK-3β, pGSK-3β, FoxO1, pFoxO1, PTEN, TRIM63/MuRF1 and FBXO32/atrogin-1 were measured by western blot in CKD mice with or without miR-26a. The bar graph shows the fold change of each protein band (bottom panel) or ratio of phospho-protein to total protein (top panel) compared with levels in sham mice (represented by a line at 1-fold). GAPDH was used as a loading control (Bars: mean ± se; n=9/group; *p<0.05 vs. CKD and #p<0.05 vs. sham).

