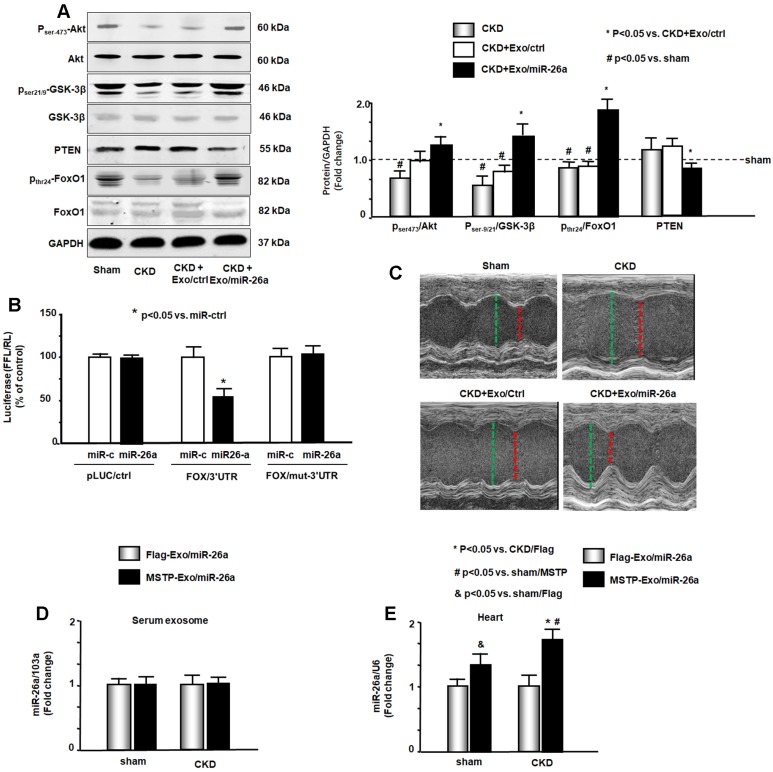
Figure 6.
miR-26a limits insulin resistance by targeting FoxO1, leading to improved cardiac function. (A) Insulin signaling protein markers Akt, p-Akt, GSK-3β, pGSK-3β, PTEN, FoxO1, and pFoxO1 were measured by western blot in the heart of sham, CKD, CKD plus Exo/ctrl and CKD plus Exo/miR-26a (Exo/miR-26a) mice. The bar graph shows the fold change of each individual protein band or ratio of phospho-protein to total protein compared with levels in sham mice (represented by a line at 1-fold). GAPDH was used as a loading control (Bars: mean ± se; n=9/group; #p<0.05 vs. sham, *p<0.05 vs. CKD plus Exo/ctrl). (B) Binding of miR-26a to the 3'-UTR of FoxO1 inhibits FoxO1 translation. H9C2 cells were transfected with luciferase pLuc-ctrl vector or the vector containing the 3'-UTR of FoxO1 (pMIR-FoxO1/3358 - 3364) or a vector containing a mutated 3'-UTR of FoxO1 (pMIR-mut-FoxO1). Cells were cotransfected with renilla luciferase as a transfection control. Cells were then transduced by adenovirus containing miR-26a precursor RNA (miR-26a) and control virus (miR-ctrl). Luciferase activity in cells that received the pLuc-ctrl (no target 3'UTR) and miR-ctrl (sequence unrelated to miR-26a) was designated as 100%. The response to miR-26a is expressed as a percent relative to the control. Bars present the results from triplicate determinations. Data: mean ± se; n=9; #p<0.05 vs. FoxO/3UTR + miR-ctrl. (C) Representative echocardiographic evaluations of cardiac function in sham, CKD, CKD plus Exo/ctrl and CKD plus Exo/miR-26a (Exo/miR-26a) mice are shown. Echocardiography was performed on lightly anesthetized mice (under 1-2% isoflurane, in oxygen) using a Vevo 3,100 ultrasound system (VisualSonics). The green line represents left ventricular end-diastolic dimensions, and the red line represents left ventricular end-systolic dimensions. Detailed information is provided in table 2. (D) Comparison of miR-26a expression in Flag-Exo/miR-26a- and MSTP-Exo/miR-26a-injected mice. RNA was isolated from serum exosomes from sham and CKD mice treated with Flag-Exo/miR-26a and MSTP-Exo/miR-26a. The expression of miR-26a-5p was assayed by real-time qPCR. The bar graph shows the expression of miR-26a from each cohort compared with levels in sham plus Flag-Exo/miR-26a injection mice (represented at 1-fold). The results are normalized to miR-103a. (Bars: mean ± se; n=6/group). (E) RNA was isolated from the hearts of sham and CKD mice. The expression of miR-26a-5p was assayed by real-time qPCR. The expression of miR-26a from each cohort compared with levels in sham plus Flag-Exo/miR-26a-injected mice (represented at 1-fold). The results are normalized to U6. (Bars: mean ± se; n=6/group; *p<0.05 vs. CKD + Flag-Exo/miR-26a, #p<0.05 vs. sham + MSTP-Exo/miR-26a, &p<0.05 vs. Flag-Exo/miR-26a).

