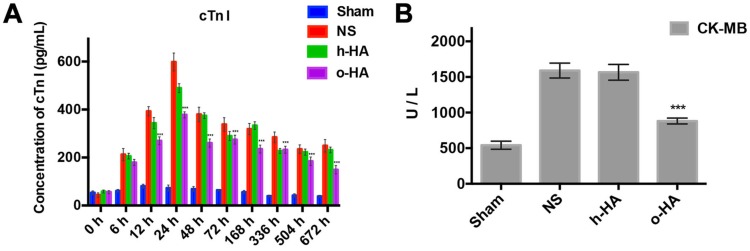
Figure 5.
Release of cTn I and CK-MB after MI. A) Values of cTn I in blood at various time point were displayed. cTn I released with early rising, reaching peak, and decreasing over several days. The o-HA group with smaller cTn I peak. B) Concentration of CK-MB in post-MI mice after being treated for 28 d.

