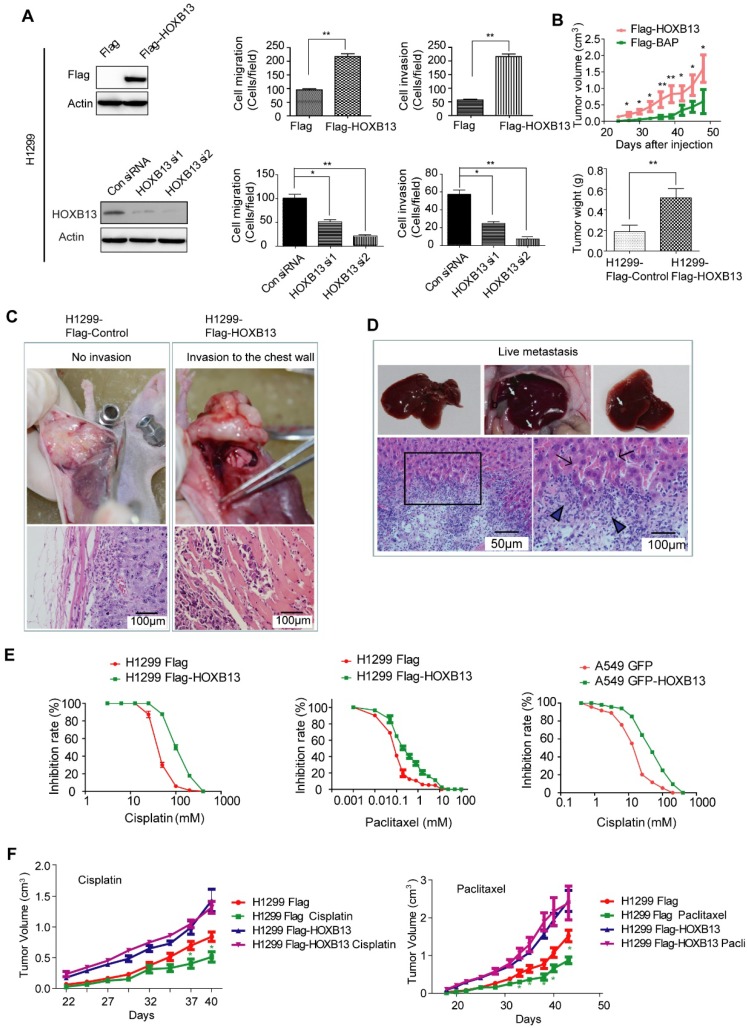
Figure 2.
HOXB13 promotes lung adenocarcinoma cell migration, invasion, and chemoresistance in vitro and in vivo. (A) HOXB13 promoted migration and invasion in H1299 cells. Upper panel: H1299 cells were stably transfected with Flag-HOXB13 and Flag empty vector as a control. Expression of Flag-HOXB13 was confirmed by Western blot analysis using the Flag antibody. HOXB13 effect on cell migration and invasion was determined in the Transwell assay by comparing H1299 cells stably expressing HOXB13 with the Flag control. Lower panel: Western blot analysis showed that HOXB13 was knocked down by two HOXB13 siRNAs in H1299 cells. H1299 cell migration and invasion was measured in the Transwell assay after HOXB13 depletion (Unpaired Student's t-test, *p < 0.05, **p < 0.01, ***p < 0.001). (B) HOXB13 promotes tumor formation in nude mice. 1×10⁶ H1299 cells stably expressing Flag-HOXB13 or control vector were inoculated into the flank of nude mice. At day 28, tumors were dissected and photographed. The mice were then maintained for 28 days. Tumor growth curve for Flag-HOXB13 cells and the control cells. The average of tumor weights at the endpoint. (Unpaired Student's t-test, *p < 0.05, **p < 0.01). (C) HOXB13 promotes local invasion of the tumor in vivo. No obvious chest invasion for the control-H1299 cells (invasion: 0/6). Chest invasion was observed for HOXB13-H1299 cells. Local invasion into the adjacent muscle was observed by histological analysis for HOXB13-H1299 cells (invasion: 2/6). (D) HOXB13 promotes lung adenocarcinoma cell liver metastasis. Upper panel left: Liver with no observed metastasized tumor. Upper panel middle and right: Liver with obviously metastasized tumors. Arrows: metastasized tumor foci. Lower panel left: Metastasized lung adenocarcinoma cells observed by histological analysis. Lower panel right: Enlarged area of the boxed region. This region is the boundary between the normal liver tissue (arrowed) and the metastasized lung adenocarcinoma cells (Arrowhead). (E) High expression of HOXB13 induced drug resistance in lung adenocarcinoma cells. Left: Drug resistance curve for enhanced expression of HOXB13 promotes A549 cell resistance to cisplatin in a WST-1 cell viability assay. Middle: Drug resistance curve for enhanced expression of HOXB13 promotes H1299 cell resistance to cisplatin. Right: Drug resistance curve for enhanced expression of HOXB13 promotes H1299 cell resistance to Paclitaxel. (F) HOXB13 promotes drug resistance to cisplatin and paclitaxel in nude mice. Left: Tumor growth curves of H1299 Flag and H1299 Flag-HOXB13 groups with or without cisplatin treatment. Cisplatin (5 mg/kg) was intraperitoneally injected three times a week from day 28 after cell inoculation. Right: Tumor growth curve of H1299 Flag and H1299 Flag-HOXB13 cells with or without paclitaxel therapy. Paclitaxel (15 mg/kg) was intraperitoneally injected three times a week from day 28 after cell inoculation. Green stars indicate H1299 Flag cell-derived tumor sensitivity to therapy and volume decrease at the indicated time after treatment. Treatment had no effect on the growth of tumors from H1299 Flag-HOXB13 cells (Unpaired Student's t-test,*p < 0.05).

