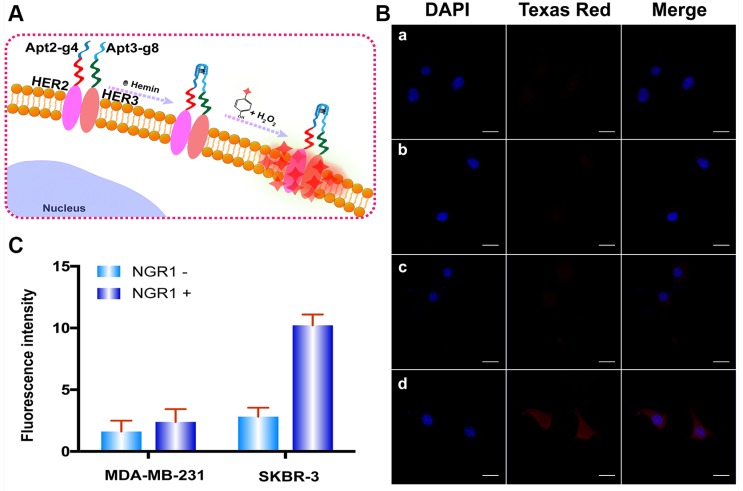
Figure 5.
(A) The Schematic diagram of HER2/HER3 heterodimers imaging based on DCTDR system. (B) Fluorescence imaging and (C) fluorescence intensity analysis of HER2/HER3 heterodimers on MDA-MB-231 cells (a, b) and SKBR-3(c, d) cells without (a, c) or with (b, d) NRG1 treatment. The data were gained from three independent experiments. Scale bar: 25 μm.

