
Figure 3.
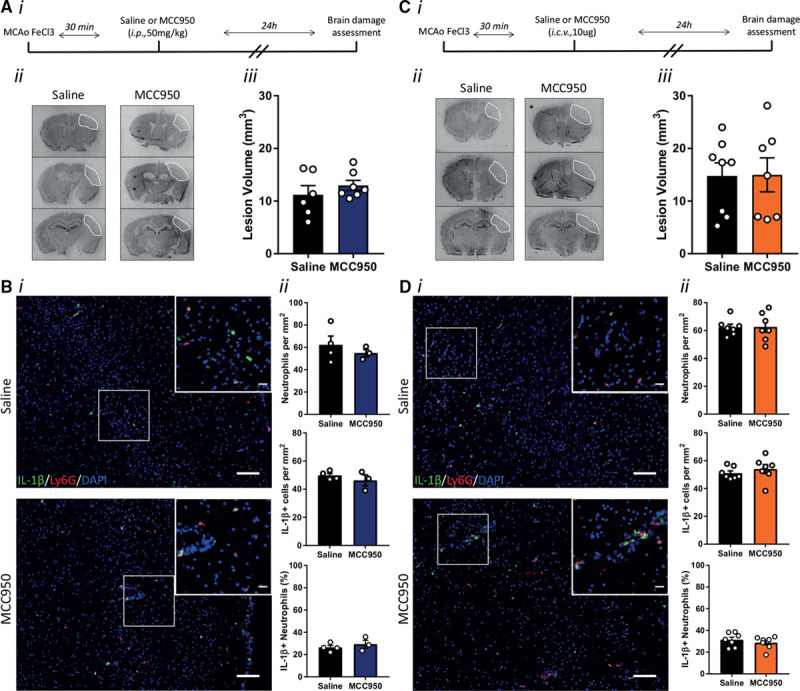
Influence of NLRP3 (NACHT, LRR and PYD domains-containing protein 3) inhibition on brain damage after stroke. A, (i) Schematic representation of experiment. A, (ii) representative cresyl violet staining and (iii) lesion volume quantification 24 h after stroke in mice treated with MCC950 (50 mg/kg) or saline by intraperitoneal injection 30 min after the stroke onset (n=6/group). B, (i) Representative immunostaining of IL (interleukin)-1β (green), neutrophils (Ly6G, red) and 4’,6-diamidine-2’-phenylindole dihydrochloride (DAPI; blue) in the infarct 24 h after stroke (scale bar in the large image is 100 μm and in the inset is 20 μm). B, (ii) Numbers of neutrophils and IL-1β positive cells per mm2, and % IL-1β positive neutrophils in the infarct 24 h after stroke plus and minus intraperitoneal MCC950 (n=3–4/group). C, (i) Schematic representation of the experiment. C, (ii) Representative cresyl violet staining and (iii) lesion volume quantification 24 h after stroke in mice treated with MCC950 (10 μg) or saline by intracerebroventricular injection 30 min after stroke onset (n=7–8/group). D, (i) Representative immunostaining of IL-1β (green), neutrophils (Ly6G, red) and DAPI (blue) in the infarct 24 h after stroke (Scale bar in the large image is 100 μm, and in the inset is 20 μm). D, (ii) Numbers of neutrophils and IL-1β positive cells per mm2, and % of IL-1β positive neutrophils in the infarct 24 h after stroke plus and minus intracerebroventricular MCC950 (n=7/group). Stroke was induced by middle cerebral artery occlusion (MCAo) using FeCl3.