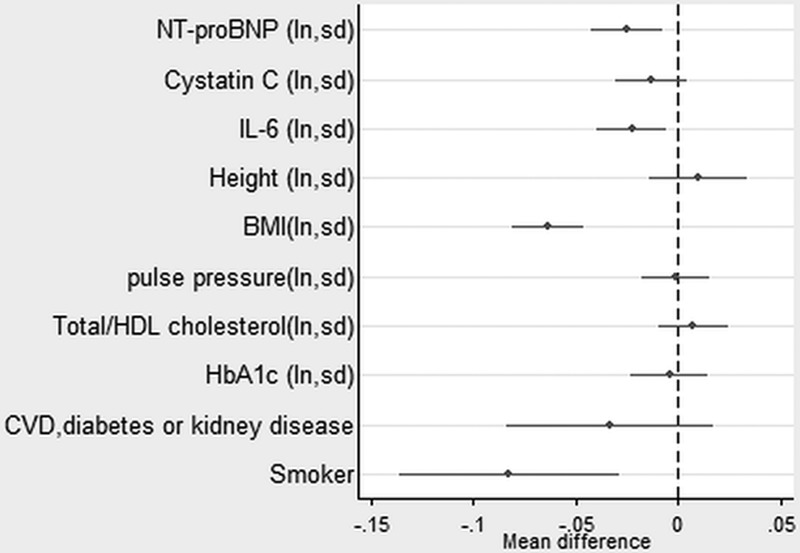
Figure 4.

Estimates from a linear regression model showing the mean difference in walking speed (meters per second) by mutually adjusted natural logged novel and conventional risk factors (also adjusted for sex and childhood and lifetime socioeconomic position). See also Table II in the online-only Data Supplement. BMI indicates body mass index; CVD, cardiovascular disease; HbA1c, hemoglobin A1c; HDL, high-density lipoprotein; IL, interleukin; ln, natural logarithm; NT-proBNP, N-terminal pro-B-type natriuretic peptide; and sd, 1 standard deviation.
