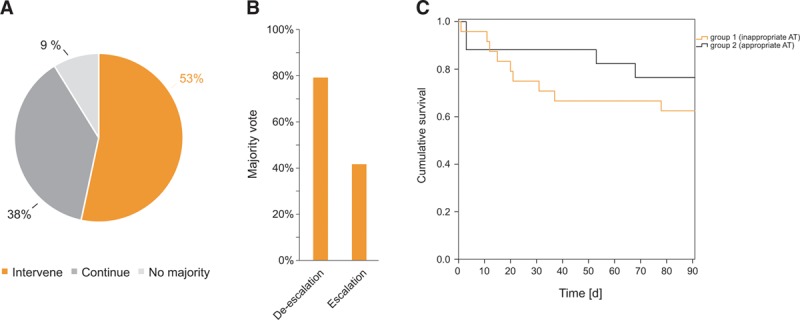
Figure 3.

Expert evaluation of the impact of next-generation sequencing (NGS) results on the antimicrobial therapy (AT). A, Results from the majority vote regarding the hypothetical therapy intervention based on NGS results (question two of the questionnaire). B, Percentage of answers evaluated by majority vote regarding the nature of therapy intervention (question three of the questionnaire). C, Kaplan-Meier curve for patient’s survival concerning group 1 (inappropriate AT) versus group 2 (appropriate AT). The orange line indicates group 1, the black line indicates group 2. Patients’ survival is given as cumulative survival over a period of 90 d.
