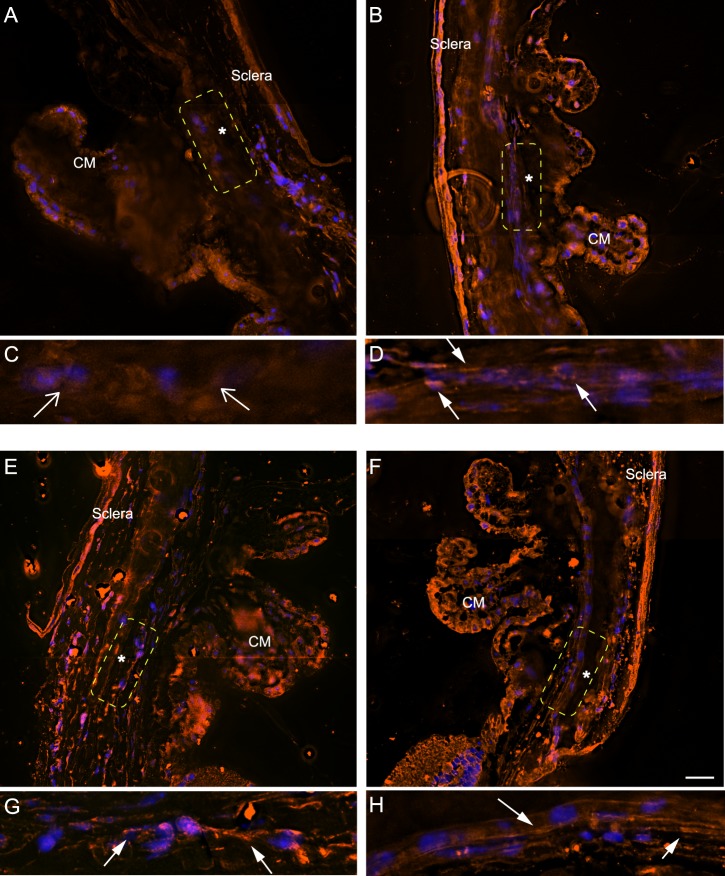
Figure 5.
β3 integrin labeling of Cre+/− β3flox/flox or Cre−/− β3flox/flox mice treated with or without tamoxifen. The TM-SC outflow pathway is outlined by the yellow dotted rectangle. The asterisk indicates SC. (A) Cre+/− β3flox/flox mouse treated with tamoxifen, (B) untreated Cre+/− β3flox/flox mouse. (C) Enlargement of the TM in (A). Open arrows indicate a lack of β3 integrin labeling. (D) Enlargement of the TM in (B). Closed arrows indicate β3 integrin labeling that is missing in (C). (E) Cre−/− β3flox/flox mouse treated with tamoxifen and (F) untreated Cre−/− β3flox/flox mouse. (G) Enlargement of the TM in (E). Closed arrows indicate β3 integrin labeling. (H) Enlargement of the TM in (F). Closed arrows indicate β3 integrin labeling. Micrographs are representative of several anterior segments. (A) n = 2, (B) n = 3, (C) n = 3, (D) n = 2. SC, Schlemm's canal. Scale bar: 20 μm.

