Figure 6.
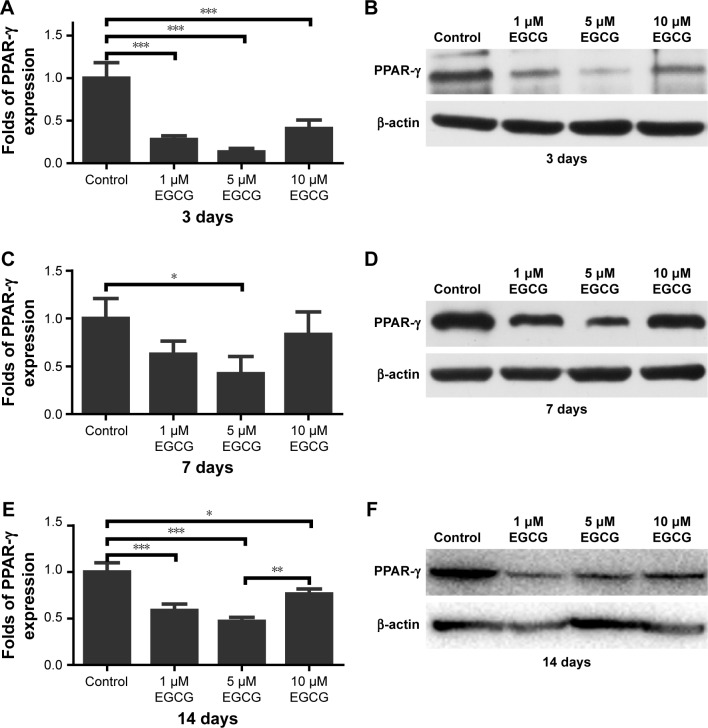
Western blotting was used to analyze the expression of adipogenic genes PPAR-γ in hASCs cultured in various concentrations of EGCG for 14 days. EGCG suppressed the expression of PPAR-γ, and 5 μM was optimal for suppressing PPAR-γ expression.
Notes: (A) On day 3, EGCG at all concentrations significantly suppressed PPAR-γ expression. (B) PPAR-γ expression at day 3 of osteogenic induction. (C) On day 7, EGCG at 5 μM significantly downregulated PPAR-γ expression. (D) PPAR-γ expression at day 7 of osteogenic induction. (E) EGCG at all concentrations significantly suppressed PPAR-γ expression on day 14, and the expression level in the 5 μM EGCG group was lowest. (F) PPAR-γ mRNA expression at day 14 of osteogenic induction. All data are presented as mean and SD. *p<0.05; **p<0.01; and ***p<0.001 (N=3).
Abbreviations: EGCG, epigallocatechin-3-gallate; hASCs, human adipose-derived stem cells.

