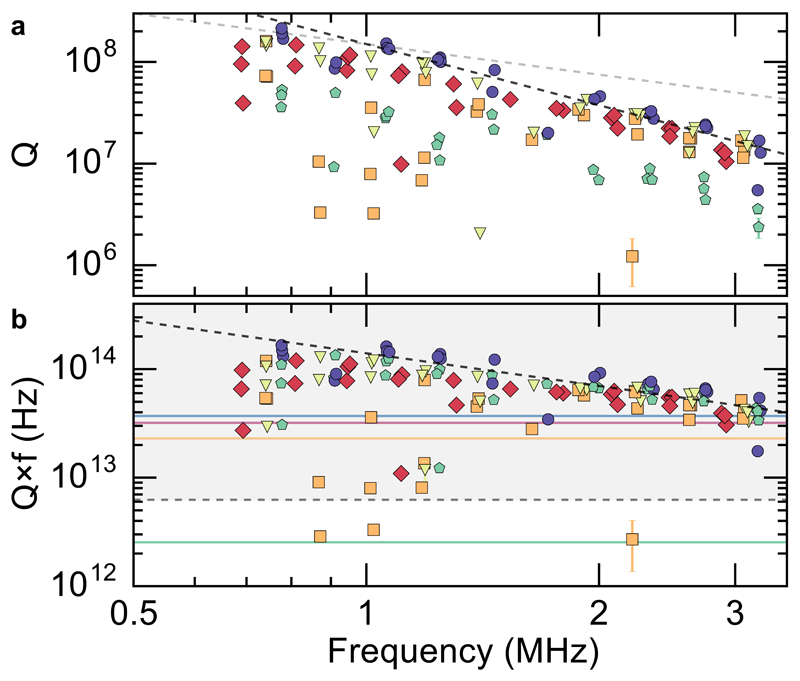
Fig. 2. Quality factor statistics.
a) Measured Q-factors of A-E defect modes in membranes of h = 35 nm thickness and different size. Black (grey) dashed line is a Q ∝ f−2 (Q ∝ f−1) guide to the eye. Colours indicate different localised defect modes, as in Fig. 1c. b) Corresponding Qf-products. For reference, solid orange, red and blue lines indicate the “quantum limit” of crystalline silicon, quartz and diamond resonators, respectively [28]. Solid green line shows the expected value for the fundamental mode of a square membrane under σ = 1 GPa stress (4), and dashed grey line indicates Qf = 6 × 10¹² Hz required for room-temperature quantum optomechanics and reached by trampoline resonators [20] at f ≈ 0.2 MHz (not shown).

