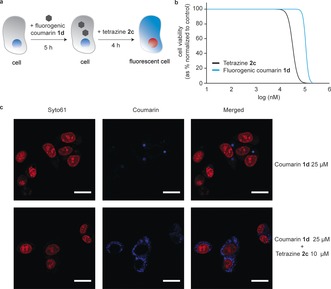
Figure 3.

a) General protocol for 2 c‐mediated intracellular decaging of fluorogenic coumarin 1 d. b) Cytotoxicity dose‐response curves of 2 c and 1 d in HepG2 cells, obtained after 48 hours of exposure. c) Detection of fluorescent coumarin (blue) upon tetrazine decaging inside HepG2 cells by confocal microscopy. Cells were incubated for 5 hours with 25 μm 1 d and then for 4 hours with 10 μm of 2 c (bottom panel) or equivalent vehicle control (top panel). Before image acquisition, nuclei were stained with Syto61 (red). Scale bar represents 20 μm.
