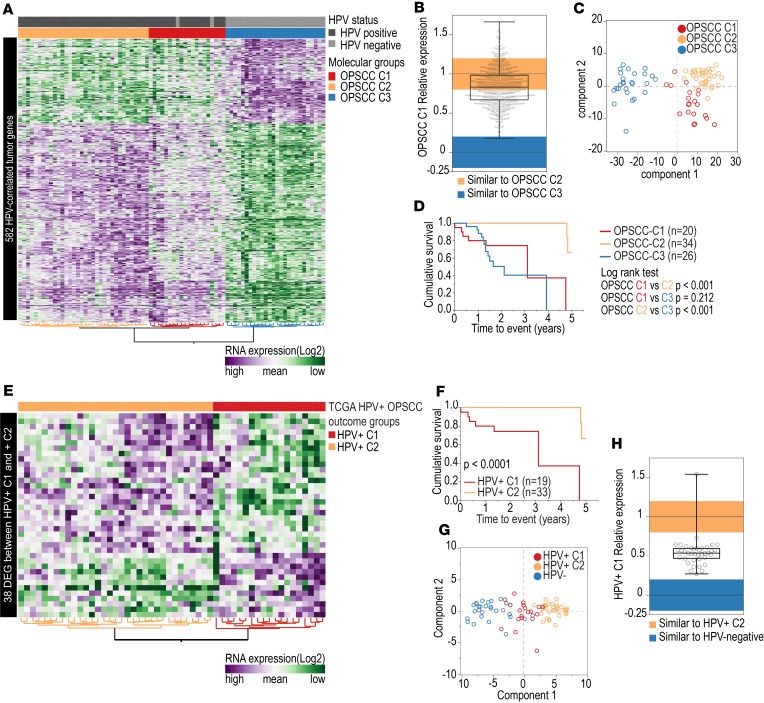
Figure 1. Expression of HPV-correlated human tumor genes among OPSCC samples.
(A) Expression of 582 HPV-correlated genes (vertical axis) among 80 OPSCC patients (horizontal axis) from TCGA. Three groups with distinct gene expression were identified: OPSCC C1 (n = 20, 2 HPV– and 18 HPV+), C2 (n = 34, all HPV+), and C3 (n = 26, all HPV–). (B) Expression of 582 HPV-correlated genes in OPSCC C1 (n = 20) group relative to OPSCC C2 (n = 34) and to OPSCC C3 (n = 26) groups. Vertical axis represents the product of fold change (log2) between OPSCC C1 and OPSCC C3 and between OPSCC C2 and C3. Values close to 0 (–0.2 to 0.2, blue) indicate OPSCC C1 gene expression similar to OPSCC C3 mean. Values close to 1 (0.8 to 1.2, orange) indicate OPSCC C1 gene expression similar to OPSCC C2 mean. Gene expression in OPSCC C1 group was similar to OPSCC C2 in 50% of cases (n = 291) and was intermediate between OPSCC C2 and C3 in 44% (n = 256) of cases. (C) PCA confirmed the different expression profiles among the groups of OPSCC (n = 80). (D) Survival curves indicate that the OPSCC C1 (7 deaths) and OPSCC C3 (13 deaths) groups had significantly lower survival rates in the 5-year follow-up period compared with OPSCC C2 group (2 deaths). (E) Expression of 38 HPV-correlated genes (differentially expressed between OPSCC C1 and OPSCC C2) (vertical axis) among TCGA patients with HPV+ OPSCC (n = 52) shows 2 groups of patients, HPV+ C1 (n = 19) and HPV+ C2 (n = 33). (F) Survival curves show that the HPV+ C1 group had a significantly lower 5-year survival rate than the HPV+ C2 group (log-rank test). (G) PCA based on expression levels of 38 HPV-correlated genes indicates HPV+ C1 (n = 19) samples have an intermediate expression profile between HPV– (n = 28) and HPV+ C2 (n = 33) samples. (H) Expression of 38 HPV-correlated genes in HPV+ C1 (n = 19) group relative to HPV+ C2 (n = 33) and HPV– (n = 19) groups. Vertical axis represents the product of fold change (log2) between HPV+ C1 and HPV– and between HPV+ C2 and HPV–. Values close to 0 (–0.2 to 0.2, blue), indicate HPV+ C1 gene expression similar to HPV– cases. Values close to 1 (0.8 to 1.2, orange), indicate HPV+ C1 gene expression similar to HPV+ C2 mean. Expression levels of 97% (n = 37) of these genes in HPV+ C1 group were intermediate between HPV+ C2 and HPV– groups.

