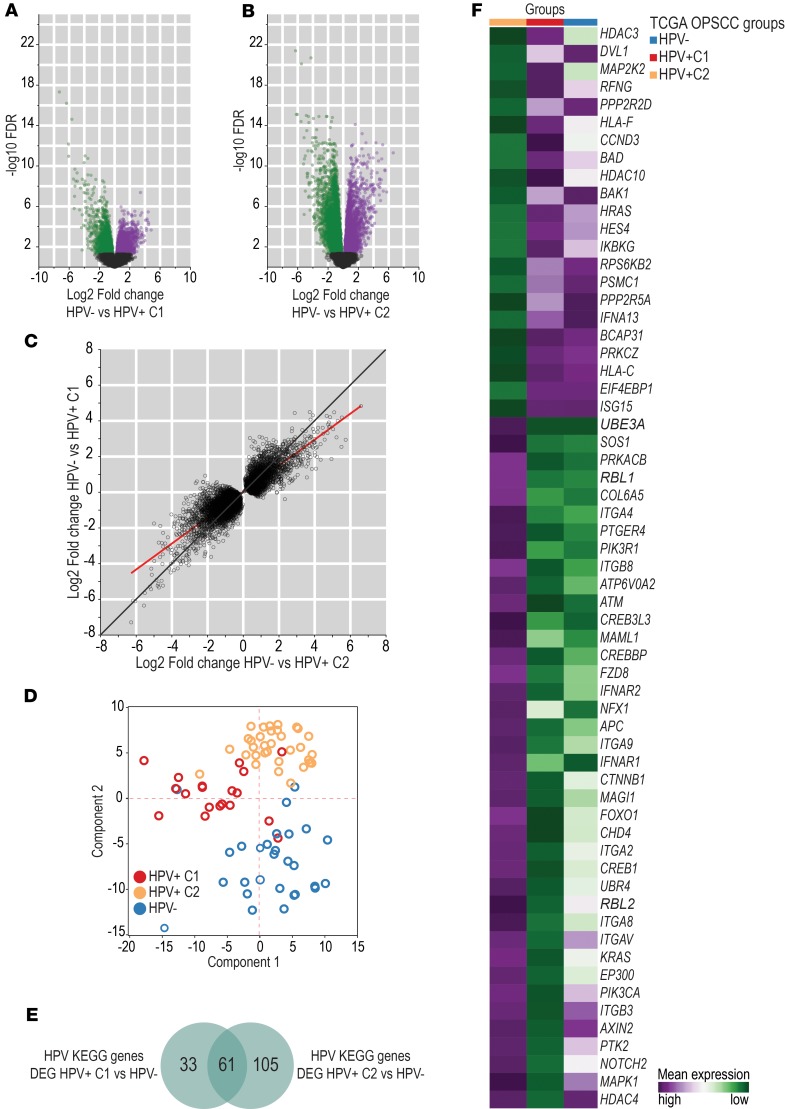
Figure 2. Human transcriptome differences between HPV+ C1 and HPV+ C2 groups.
Volcano plot showing log2 fold-change (horizontal axis) and –log10FDR (vertical axis) values from the whole transcriptome analysis between HPV– (n = 28) and HPV+ C1 (n = 19) OPSCC (A) and between HPV– (n = 28) and HPV+ C2 (n = 33) OPSCC groups (B). Genes were considered differentially expressed at a significance level of 0.05 (n = 4366 in A and n = 8724 in B). Green dots represent differentially expressed genes with lower expression in HPV– cases than in HPV+ C1 cases (n = 2537 in A and n = 5268 in B). Purple dots represent differentially expressed genes with higher expression in HPV– cases than in HPV+ C1 cases (n = 1829 in A and n = 3456 in B). Black dots represent genes whose expression was not significantly different between groups. (C) 7760 differentially expressed genes between HPV+ (n = 52) and HPV– (n = 28) OPSCC cases and their corresponding log2 fold-change values when their expression was compared between HPV– (n = 28) and HPV+ C1 cases (n = 19) (vertical axis) and between HPV– (n = 28) and HPV+ C2 cases (n = 33) (horizontal axis). The red line represents the best-fit calculated by linear regression. The black line represents the 45° line. The line of best-fit slope was lower than 1 (0.72 ± 0.004), indicating greater log2 fold-change values in the horizontal axis (HPV– vs. HPV+ C2) than in the vertical axis (HPV– vs. HPV+ C1). This suggests that differences in expression levels of HPV-related genes were smaller between HPV+ C1 and HPV– cases than between HPV+ C2 and HPV– cases. (D) PCA using expression of 319 genes from the HPV-KEGG pathway database among all 80 TCGA OPSCC cases. All 3 groups (HPV+C1, n = 19; HPV+C2, n = 33; HPV–, n = 28) showed distinct expression profiles of HPV-related genes. (E) Venn diagram representing HPV-KEGG pathway genes differentially expressed between HPV+ C1 (n = 19) and HPV– cases (n = 28) and between HPV+ C2 (n = 33) and HPV– (n = 28) cases. A greater number of HPV-related genes was differentially expressed between HPV+ C2 and HPV– cases. This suggests that the HPV+ C1 group exhibited expression of some HPV-related genes similar to that in HPV– cases. (F) Mean expression of 61 HPV-KEGG pathway genes among HPV+ C1 (n = 19), HPV+ C2 (n = 33), and HPV– (n = 28) cases. These 61 genes were differentially expressed between HPV+ C1 and HPV+ C2 but not between HPV+ C1 and HPV– cases, suggesting that HPV+C1 cases lost part of their HPV characteristics.

