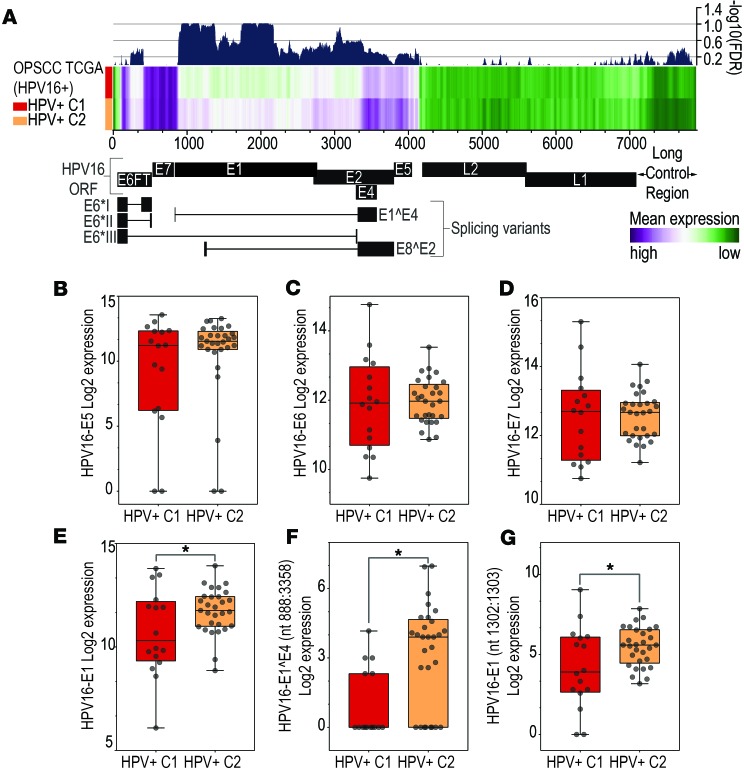
Figure 3. HPV transcriptome differences between HPV+ C1 and HPV+ C2 groups.
(A) Heatmap representing the mean expression levels of each HPV16 nucleotide (horizontal axis) among the HPV+ C1 (n = 19) and HPV+ C2 (n = 33) groups. Dark blue indicates the –log10 FDR (right vertical axis) determined by comparing differences in expression between the 2 groups. Expression levels of E5 (P > 0.05) (B), E6 (P > 0.05) (C), E7 (P > 0.05) (D), and E1 (*P = 0.03, FDR = 0.29) (E) HPV16 exons in HPV+ C1 (n = 19) and HPV+ C2 (n = 33) groups. Expression of E1 (nt1302:1303) (*P = 0.02, FDR = 0.09) (F) and E1^E4 (nt880:3358) (*P < 0.001, FDR = 0.006) (G) splicing junctions was significantly lower among HPV+ C1 (n = 19) cases.

