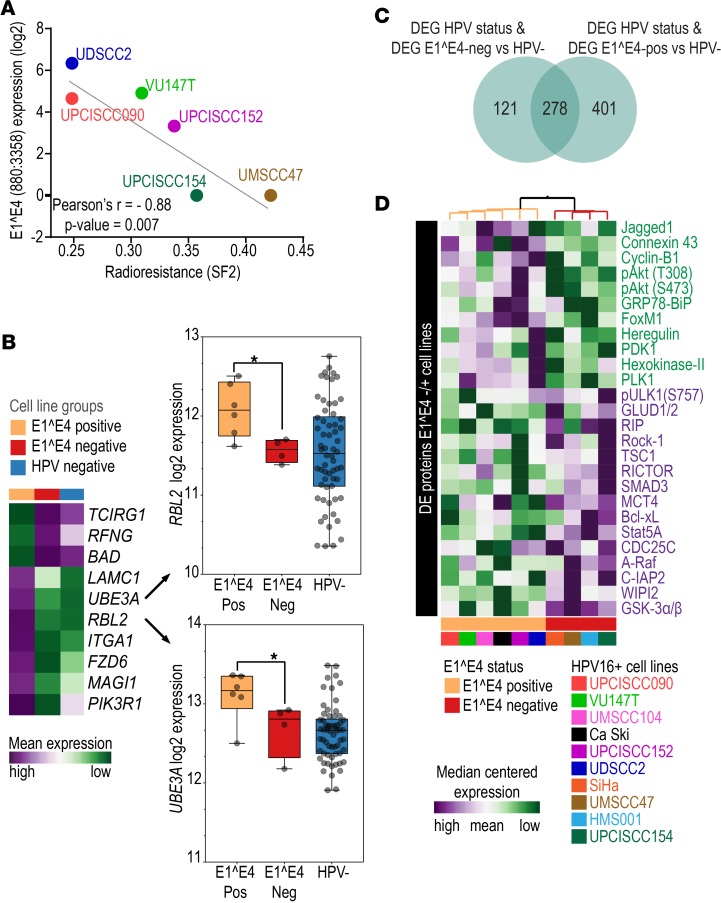
Figure 4. Molecular phenotypic characteristics of HPV16+ squamous cell carcinoma cell lines.
(A) Pearson’s correlation analysis between radioresistance (SF2) (horizontal axis) and expression of E1^E4 splicing junction (vertical axis) among 6 cell lines indicates a significant inverse correlation. Cell lines with higher radioresistance (higher SF2 values) tended to express lower levels of E1^E4 splicing junction transcripts. (B) Mean expression levels of 10 HPV-KEGG genes among E1^E4+ (n = 6), E1^E4– (n = 4), and HPV– (n = 62) cell lines. These genes were differentially expressed between E1^E4– and E1^E4+ HPV16+ cell lines and between HPV+ C1 (n = 19) and HPC+ C2 (n = 33) tumors and showed similar expression between E1^E4– and HPV– cells and between HPV+ C1 and HPV– (n = 28) tumors. This suggests altered HPV function among E1^E4– cells and HPV+ C1 tumors. (C) Venn diagram representing the numbers of differentially expressed genes (DEG) between HPV+ (n = 17) and HPV– (n = 62) cell lines (n = 925) that were also differentially expressed between E1^E4– (n = 4) and HPV– cell lines (n = 399 genes) and between E1^E4+ (n = 6) and HPV– cell lines (n = 679 genes). E1^E4+ cell lines showed a significantly (P < 0.0001, 2-tailed Fisher’s exact test) higher number of differentially expressed genes than E1^E4– cell lines. (D) Expression profile of the most differentially expressed (DE) proteins (P ≤ 0.1) (n = 26) (vertical axis) among HPV+ cell lines (n = 10) (horizontal axis) with distinct E1^E4 expression status (E1^E4+, n = 6; E1^E4–, n = 4).

