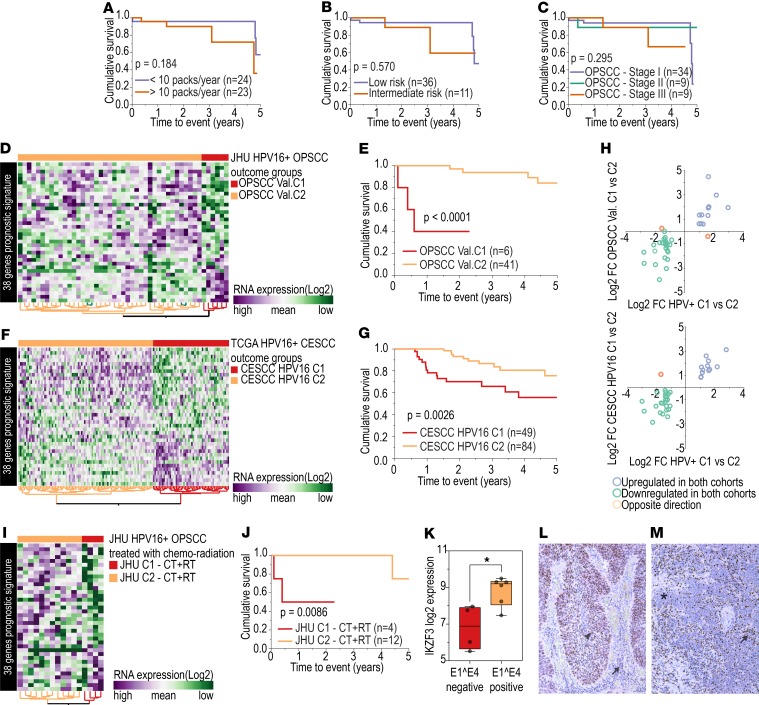
Figure 5. Prognostic biomarker assessment.
Log-rank test shows no significant differences in survival among patients with HPV+ OPSCC grouped according to (A) number of cigarette packs smoked per year (n = 47); (B) low or intermediate risk according to the risk stratification system proposed by Ang et al. (13) (n = 47; low risk: ≤10 packs smoked per year and N0-N2a; intermediate risk: >10 packs smoked per year and N2b-N3); and (C) AJCC staging system for OPSCC (8th edition) (n = 52). (D) Expression profile of 38 HPV-correlated genes (vertical axis) among HPV16+ OPSCC (n = 47). JHU cohort shows 2 groups of tumors, OPSCC Val. C1 (n = 6) and OPSCC Val. C2 (n = 41). (E) OPSCC Val.C1 patients had a significantly lower 5-year survival rate (3 deaths) than those in the OPSCC Val.C2 group (4 deaths) (log-rank test). (F) Expression profile of 38 HPV-correlated genes (vertical axis) among HPV16+ CESCC patients (n = 138) from TCGA shows 2 groups of tumors, CESCC HPV16 C1 (n = 50) and CESCC HPV16 C2 (n = 88). (G) CESCC HPV16 C1 patients (15 deaths) had a significantly lower 5-year survival rate than the CESCC HPV16 C2 group (10 deaths) (log-rank test). (H) Of the 38 genes in the signature, 36 showed similar patterns of expression (upregulation or downregulation) among the groups with lower survival rates (C1) from the TCGA (n = 19) (horizontal axis) and JHU (n = 6) (vertical axis) cohorts compared with the groups with higher survival rates (C2) (TCGA, n = 33; JHU n = 41). Only INHBA and DPF1 genes showed the opposite expression direction. Comparing TCGA HPV+ OPSCC (n = 52) and CESCC (n = 138) cohorts, all but one gene (INHBA) showed the same pattern of expression in the poorer prognosis group from both cohorts (TCGA HPV+ OPSCC, n = 19; TCGA HPV+ CESCC, n = 50). (I) Expression profile of 38 selected genes among samples from the JHU cohort treated primarily with chemotherapy and/or radiotherapy (n = 16) revealed 2 distinct groups (JHU C1 – CT+RT, n = 4, and JHU C2 CT+RT, n = 12). (J) JHU C1 – CT+RT group showed significantly shorter survival (log-rank test). (K) Expression of IKZF3 was significantly lower among E1^E4– cell lines (n = 4) than among E1^E4+ cell lines (n = 6) (*P = 0.013, t test). Low IKZF3 expression was observed among HPV+ C1 tumors, and its low expression was associated with shorter survival. (L) HPV+ OPSCC showing IKZF3 protein expression in tumor (arrowhead) and inflammatory cells (arrow) detected by immunohistochemistry. (M) HPV+ OPSCC showing no IKZF3 expression in tumor cells (asterisk) and strong expression in inflammatory cells (arrow) (original magnification, ×40).

