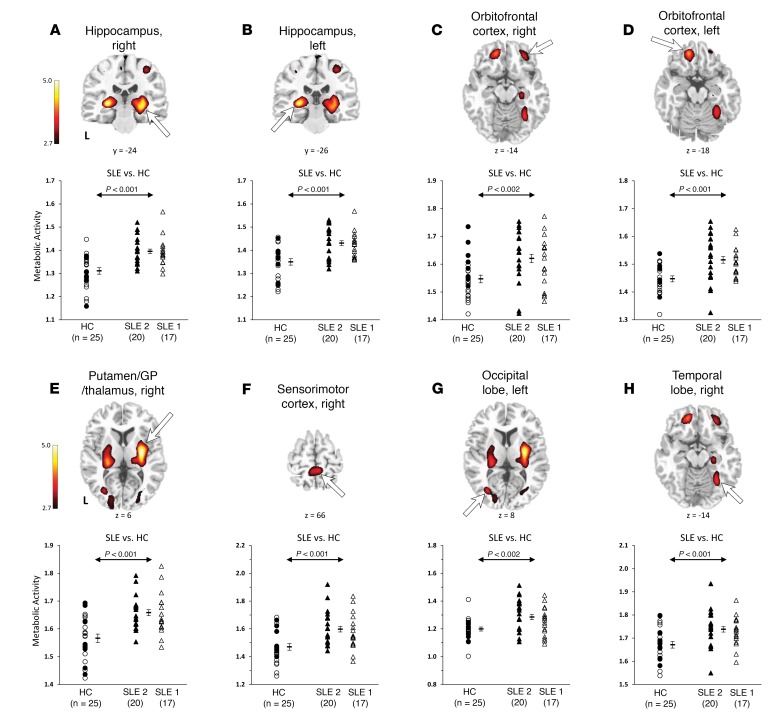
Figure 1. Abnormal hypermetabolic regions in SLE.
Top: Voxel-wise comparison of the FDG-PET scans between the combined SLE-1/2 cohorts (n = 37) and healthy controls (HCs; n = 25) revealed significant increases in resting glucose metabolism in SLE subjects in the hippocampus (A and B), orbitofrontal cortex (BA 11) (C and D), and putamen/GP/thalamus (E), the same regions independently identified in SLE-1 (1) and SLE-2 (Supplemental Data). Three new hypermetabolic regions identified in the SLE-1/2 subjects include the SMC (F), occipital lobe (BA 19) (G), and temporal lobe (BA 37) (H). (Peak voxel of each cluster was significant at P < 0.001, uncorrected. Clusters for the hippocampus, putamen/GP/thalamus, and SMC were also significant at P < 0.05, corrected for cluster extent [Table 3]. Clusters were displayed using a red-yellow scale thresholded at P < 0.005 superimposed on a MRI template.). Bottom: Metabolism in these regions was significantly higher (P < 0.002) in the SLE-1/2 subjects (triangles) than in the healthy controls (circles) but not different between the SLE-1 (white triangles) and SLE-2 (black triangles) subjects (P > 0.41). (Error bar represents standard error of the mean. Arrow represents Student’s t test of SLE-1/2 subjects vs. HCs.)

