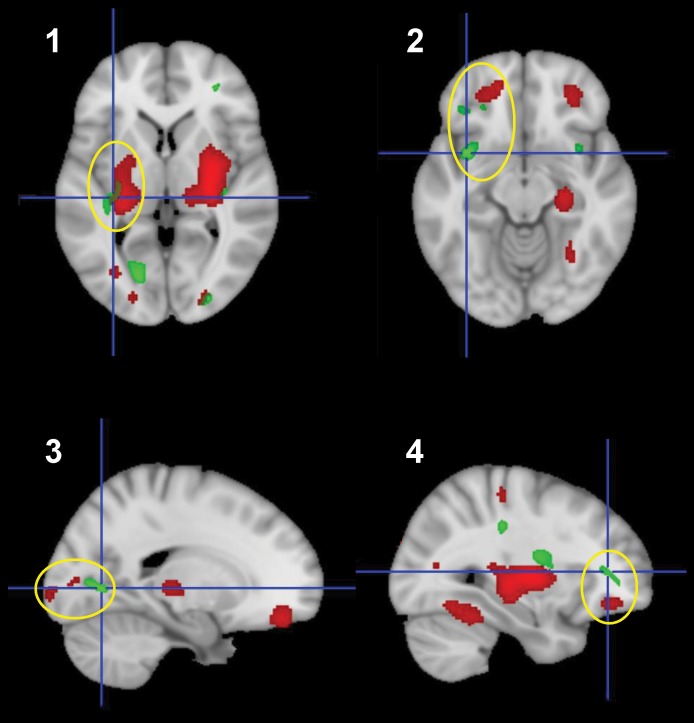
Figure 4. Spatial proximity of white matter regions with abnormal reductions in fractional anisotropy in SLE-2 patients and areas of increased metabolic activity in adjacent gray matter.
White matter regions with abnormal reductions in fractional anisotropy are represented in green (clusters 1–4, see Figure 3 and Table 4); areas of increased metabolic activity in adjacent gray matter are represented in red (see Figure 1 and Table 3. Adjacent gray and white matter regions are encompassed by yellow ellipses. (Clusters represent areas with significant differences in local fractional anisotropy [FA] or metabolic activity in SLE vs. healthy control subjects [thresholded at T = 3.0, P < 0.005], overlaid on the MNI152 T1 MRI template.).

