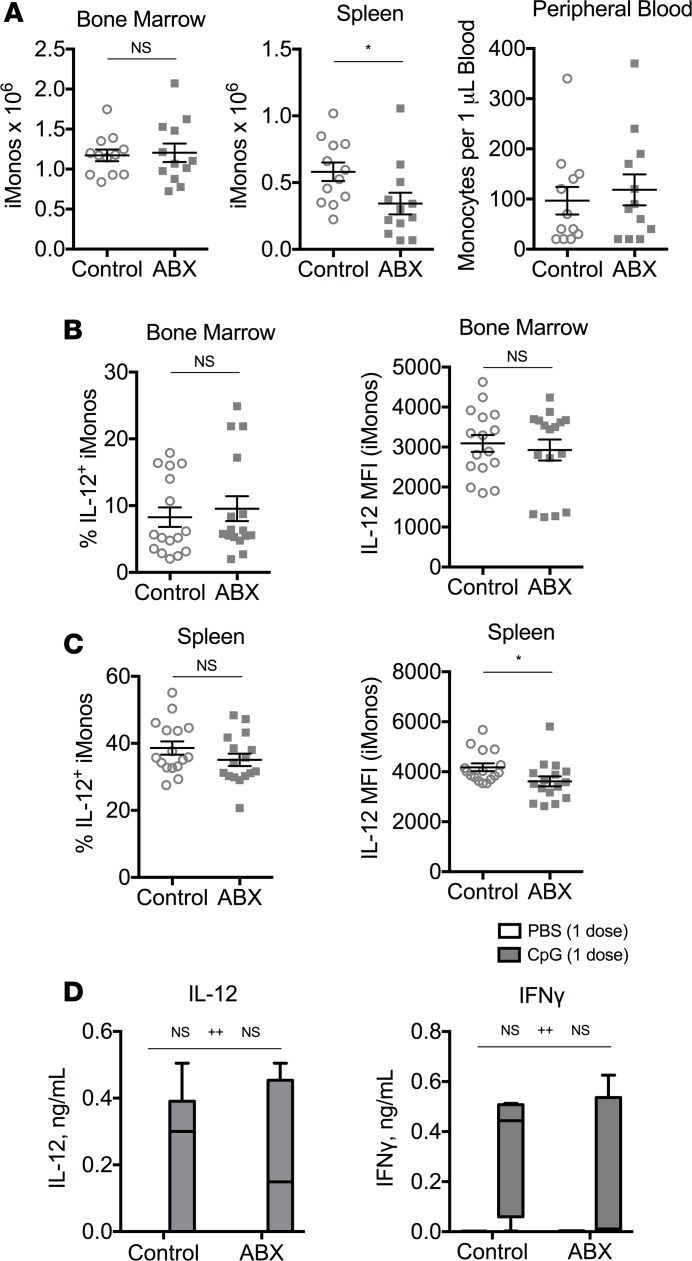
Figure 3. Initial TLR9 responses are preserved in antibiotic-treated mice.
(A) Numbers of monocytes from the bone marrow, spleen, and peripheral blood were enumerated from mice treated with antibiotic or control water for 3 weeks. (B and C) Whole bone marrow and spleen cells were isolated from antibiotic-treated and control mice. CpG-responsive bone marrow (B) and spleen (C) inflammatory monocytes (iMonos) were calculated by the percentage of Ly6G–CD11b+ monocytes staining positive for intracellular IL-12 after stimulation with brefeldin A and CpG1826 for 12–18 hours (left). Median fluorescence intensity (MFI) of IL-12 was measured on IL-12+ monocytes (right). (D) Antibiotic-treated (ABX) and control mice were treated with a single dose of PBS or CpG1826, and sera were harvested 20 hours later to measure IL-12 and IFN-γ. Data are graphed as box-and-whiskers plots showing minimum/maximum, and the line in the box shows the median value. Data from A and B are compiled from 3 experiments (N = 12–16 per group) and analyzed by the Mann-Whitney test. Data from C are representative of 2 independent experiments (N = 6 per group) and analyzed by 2-way ANOVA (*P < 0.05,interaction; ++P < 0.01, control vs. antibiotic treated). Interaction term is CpG treatment x Antibiotic treatment.

