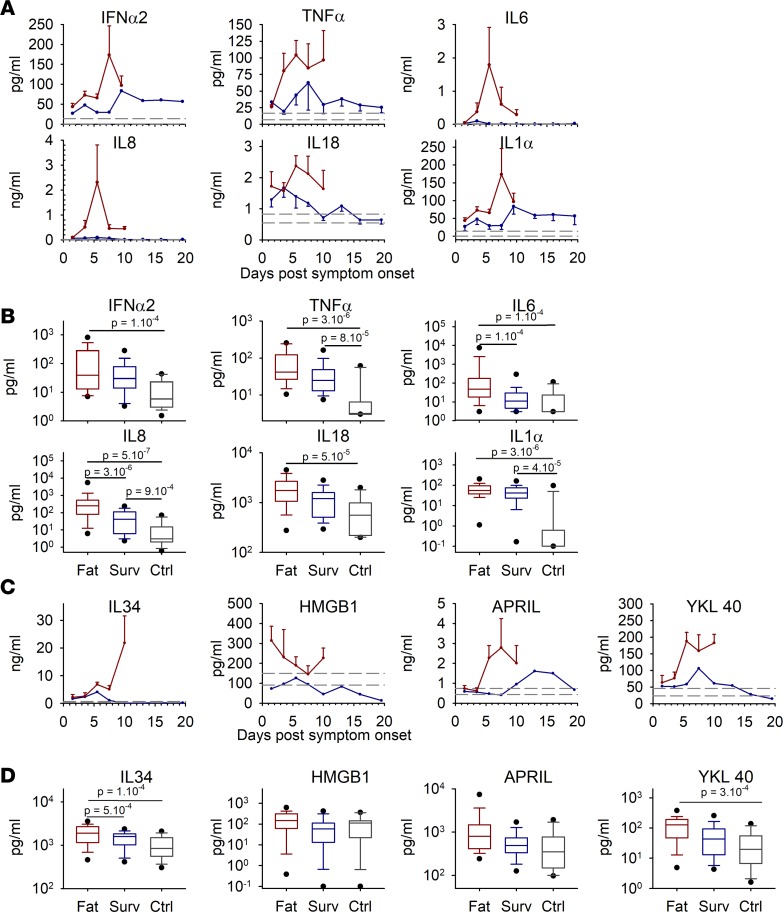
Figure 4. The proinflammatory response was evaluated in plasma samples by ELISA (IFN-α2 only) or magnetic bead multiplex assay.
(A) Kinetics are presented as mean values with standard error of the mean for each time point (red: fatal cases, n = 44; blue: survivors, n = 58). Dashed lines represent the mean value ± standard error of the mean of the controls (n = 15). (B) Box plots represent all time points combined for each group, with only the first sample for each patient analyzed. The boxes define the 25th and 75th percentiles, with a line at the median; error bars define the 10th and 90th percentile; and dots define the 5th and 95th percentile (fatal cases [Fat], n = 42; survivors [Surv], n = 33; controls [Ctrl], n = 15). The P values were determined by a Wilcoxon rank sum test and are indicated in the box plots. (C) Assay of cytokines with a role in the reinforcement of proinflammatory responses. Representation is the same as in A. (D) Box plots associated with the markers from C. Representation, samples, and statistical analysis are the same as in B.

