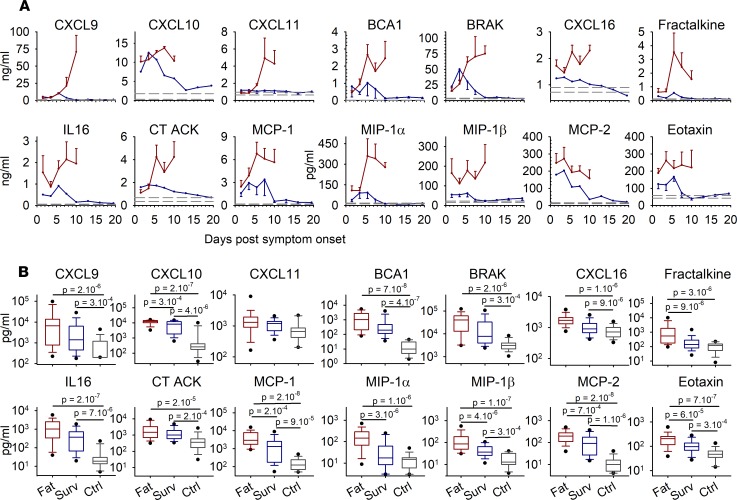
Figure 6. Chemokines expressed in plasma samples were assayed using multiplex bead panels, as in Figures 4 and 5.
(A) Kinetics are presented as mean values with standard error of the mean for each time point, as in Figure 4, A and C, and Figure 5, A and C, with fatal cases (n = 44), survivors (n = 58), and controls (n = 15). (B) The box plots represent all time points combined for each group, with only the first sample for each patient analyzed, as in Figure 4, B and D, and Figure 5B (fatal cases [Fat], n = 42; survivors [Surv], n = 33; controls [Ctrl], n = 15). The boxes define the 25th and 75th percentiles, with a line at the median; errors bars define the 10th and 90th percentile; and dots define the 5th and 95th percentile. The P values were determined by a Wilcoxon rank-sum test and are indicated in the box plots.

