Abstract
The incidence of acute myeloid leukaemia (AML) increases with age and mortality exceeds 90% when diagnosed after age 65. Most cases arise without a detectable prodrome and present with the acute complications of bone marrow failure1. The onset of such de novo AML cases is typically preceded by the accumulation of somatic mutations in pre-leukaemic haematopoietic stem and progenitor cells (HSPC) that undergo clonal expansion2,3. However, recurrent AML mutations also accumulate in HSPCs during ageing of healthy individuals who do not develop AML, a phenomenon referred to as age-related clonal haematopoiesis (ARCH),4–8. To distinguish individuals at high risk of developing AML from those with benign ARCH, we undertook deep sequencing of genes recurrently mutated in AML in the peripheral blood cells of 95 individuals sampled on average 6.3 years before AML diagnosis (pre-AML group), together with 414 unselected age- and gender-matched individuals (control group). Pre-AML cases were distinct from controls with more mutations per sample, higher variant allele frequencies (VAF) reflective of greater clonal expansion, and enrichment for mutations in specific genes. Genetic parameters were used to derive a model that accurately predicted AML-free survival; this model was validated in an independent cohort of 29 pre-AMLs and 262 controls. Since AML is rare, we also developed an AML predictive model using a large electronic health record database that identified individuals at greater risk. Collectively our findings provide a proof-of-concept that it is possible to discriminate ARCH from pre-AML many years prior to malignant transformation. This could in the future enable earlier detection, monitoring and potentially inform intervention.
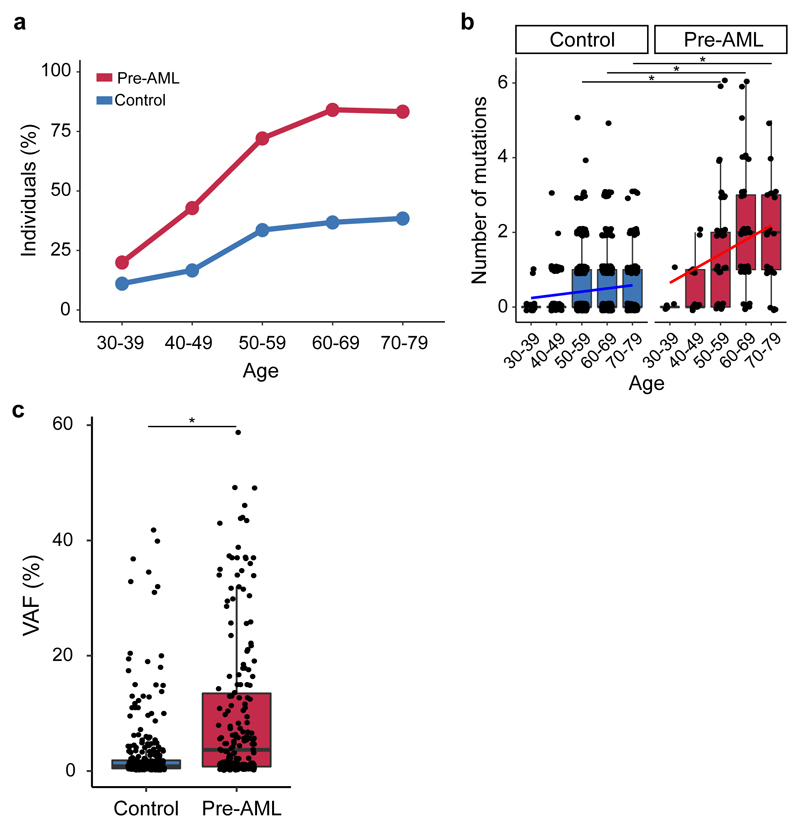
To examine the occurrence of somatic mutations prior to the development of AML, we undertook deep error-corrected targeted sequencing of AML-associated genes in a discovery cohort (DC) of 95 pre-AML cases and 414 age- and gender-matched controls (Supplementary Table 1). A validation cohort (VC) comprising 29 pre-AMLs and 262 controls (Supplementary Table 1) underwent deep sequencing with an overlapping gene panel. Taking both cohorts together, ARCH, defined on the basis of putative driver mutations (ARCH-PD), was found in 73.4% of the pre-AML cases at a median of 7.6 years prior to diagnosis. By contrast, ARCH-PD was observed in 36.7% of the controls (P<2.2 x 10⁻¹⁶, two-sided Fisher’s exact test) (Fig. 1a), consistent with data from a study of >2,000 unselected individuals assayed using a similarly sensitive method9,10. Additionally, 39% of pre-AMLs above the age of 50 harboured a driver mutation with VAF>10%, compared to only 4% of controls, a prevalence in keeping with the largest studies of ARCH in the general population4 (P<2.2 x 10⁻¹⁶, two-sided Fisher’s exact test; Extended Data Fig. 1).
Figure 1. Prevalence of ARCH, number of mutations and clone size in individuals who developed AML.
a, Prevalence of ARCH-PD among pre-AML cases (red) and controls (blue). b, The number of ARCH-PD mutations detected in cases and controls according to age. Box plot centres, hinges and whiskers represent the median, first and third quartiles and 1.5 x interquartile range, respectively. c, VAF of ARCH-PD mutations. Significant differences are defined as P<0.0005 (two-sided Wilcoxon rank sum test with Bonferroni multiple testing correction) and are indicated by asterisks (*). All panels show data for n=800 biologically independent samples.
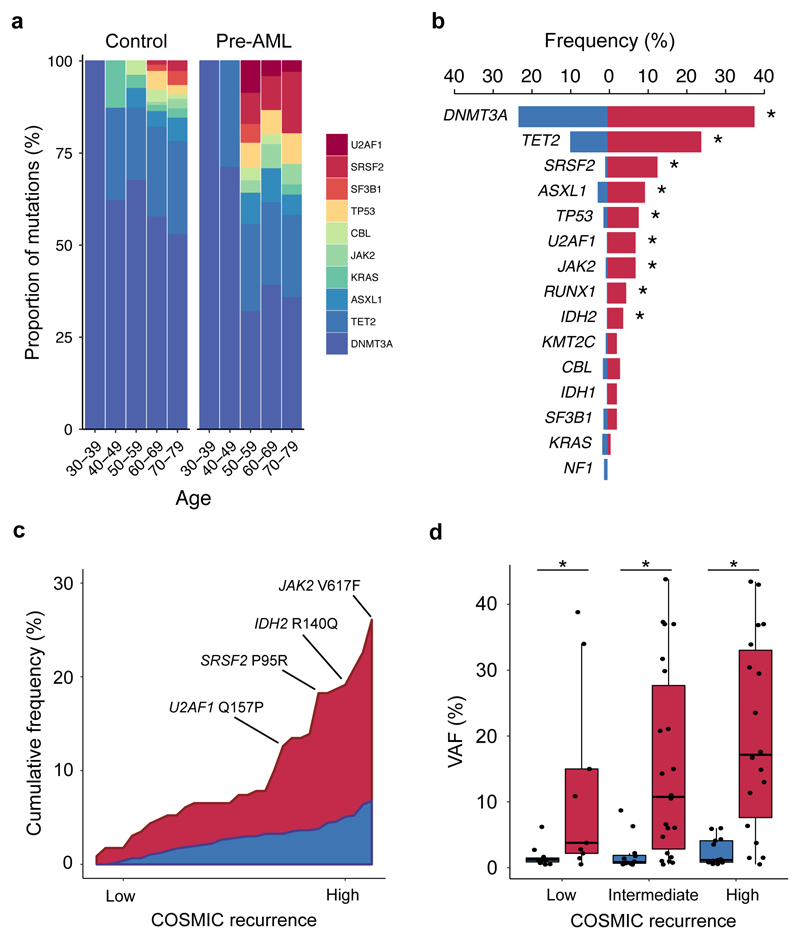
The median number of ARCH-PD mutations per individual increased with age and was significantly higher in the pre-AML group relative to controls (Fig. 1b, Supplementary Table 2). Furthermore, examination of ARCH-PD VAF distribution revealed significantly larger clones among the pre-AML cases (P=1.2 x 10⁻¹³, two-sided Wilcoxon rank sum test, Fig. 1c). To gain insight into clonal growth dynamics, we examined serially collected samples available for a subset of the VC. We did not find significant differences in clonal expansion rates between pre-AMLs and controls (Extended Data Fig. 2 a,b), although this may in part reflect the shorter follow-up of pre-AMLs, small sample size and large variance in growth rates (Extended Data Fig. 2c). The observed differences between pre-AMLs and controls may arise through cell-intrinsic or -extrinsic factors. Although these variables have not been studied adequately in ARCH, a number of observations in different contexts such as aplasia, post-chemotherapy and advanced age have shown that increased clonal fitness is associated with distinct mutations depending on context10–12. Interestingly, mutations in splicing factor genes were significantly enriched among the pre-AMLs relative to the controls (odds ratio, 17.5; 95% CI, 8.1-40.4, P=5.2 x 10⁻¹⁶, two-sided Fisher’s exact test) and presented in significantly younger individuals (median age 60.3 vs 77.3 years, P=1.7 x 10⁻⁴, two-sided Wilcoxon rank sum test, Fig. 2a). Previous work suggests that spliceosome mutations appear to confer competitive advantage in the context of ageing10. Hence it is possible that the significantly higher prevalence of such clones in younger pre-AMLs may reflect extrinsic selection pressures rather than earlier mutation acquisition.
Figure 2. Acquisition of specific recurrent AML mutations by healthy individuals at young age is associated with progression to AML.
a, Relative frequency of mutations in the indicated genes according to age group for pre-AMLs (red) and controls (blue). b, Proportion of pre-AML cases and controls harbouring ARCH-PD mutations in recurrently mutated genes. Asterisks (*) indicate P<0.05 (Fisher’s exact test with Bonferroni multiple testing correction). c, Plot showing the cumulative frequency of recurrent AML mutations (reported in >5 specimens in COSMIC) in pre-AML cases and controls. ARCH-PD mutations are ranked from left to right along the x-axis from low to high recurrence. d, VAF of recurrent mutations in cases and controls. Low, intermediate and highly recurrent COSMIC mutations are defined as those reported in 5-19 samples, 20-300 samples and >300 samples, respectively. Box plots indicate median, first and third quartiles and 1.5 x interquartile range. P-values were calculated by two-sided Wilcoxon rank sum test with Bonferroni multiple testing correction. All panels show data for n=800 unique individuals.
In keeping with previous reports9, we found that DNMT3A and TET2 were the most commonly mutated genes in both groups (Fig. 2b). We could not identify any NPM1c or FLT3-internal tandem duplication (ITD) mutations, consistent with these arising late in leukaemogenesis10,13. Recurrent CEBPA mutations, which are implicated in ~10% of de novo AML14, were also absent, suggesting that driver events in this gene may also be late events in AML evolution. In order to quantify the impact of different mutations on the likelihood of progression to AML, we ranked ARCH-PD mutations based on the number of times they have been reported in COSMIC among individuals with haematological malignancies15. We found that mutations that are highly recurrent in cancer specimens were more common in pre-AMLs than in controls with ARCH-PD, whereas driver events in the controls tended to affect loci that are less frequently mutated in haematological malignancies and occurred at significantly lower VAF (Fig. 2c, Fig. 2d). Overall, these findings demonstrate notable differences in the mutational landscape of ARCH and pre-AML. Moreover, this work, in conjunction with recent insights into the origins of AML relapse16, suggests that AML progression typically occurs through many years of pre-leukaemic HSPC clonal evolution before acquisition of late mutations leads to overt malignant transformation.
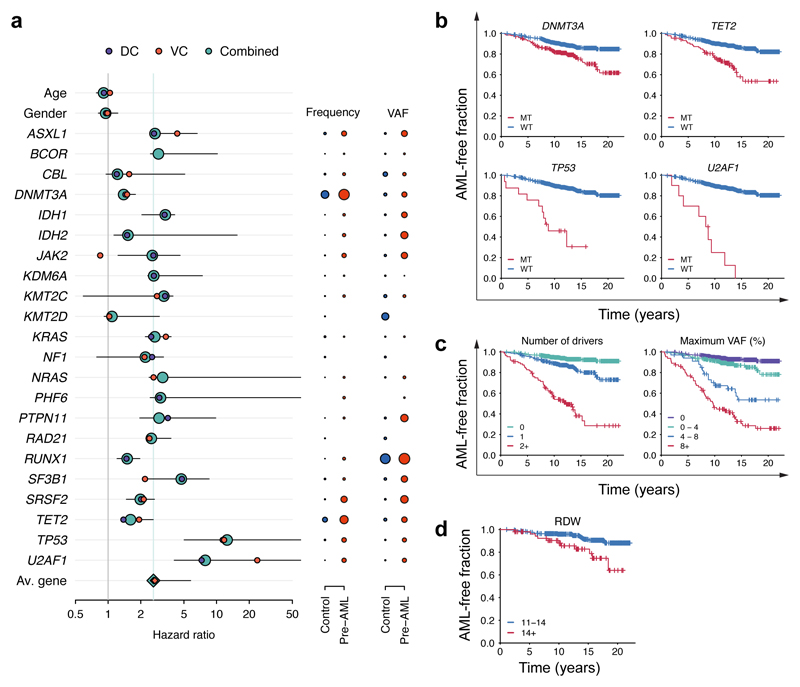
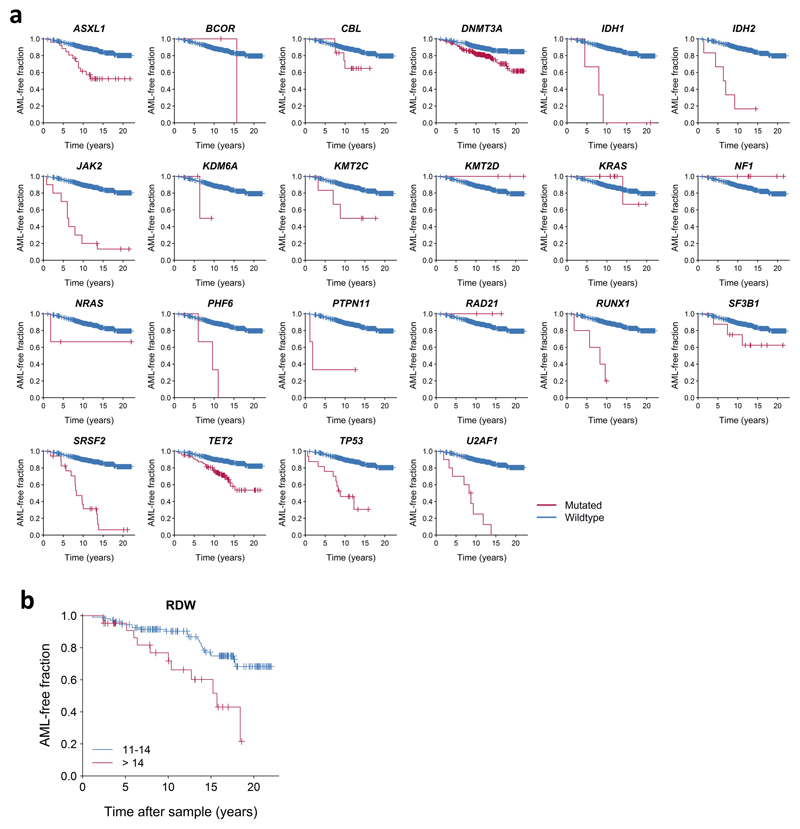
Based on these findings we next developed an approach to quantify the relative contributions of driver mutations and clone sizes to the risk of progressing to AML. We tested different regularised logistic and Cox proportional hazards regression approaches, which achieved similar performance on both DC (Concordance, C = 0.77 ± 0.03) and VC (C = 0.84 ± 0.06) (Extended Data Fig. 3 and Extended Data Fig. 4, Supplementary Table 3). Models trained on only DC or VC had similar coefficients, thereby justifying combining the data sets for a more accurate analysis of the individual risk contributions (C = 0.77 ± 0.03, AUC=0.79, Supplementary Table 3). Quantitatively, we found that driver mutations in most genes conferred an approximately two-fold increased risk of developing AML per 5% increase in clone size (Fig. 3a, Supplementary Table 3). Notable exceptions to this trend are the most frequently mutated ARCH genes, DNMT3A and TET2, which confer a lower risk of AML progression (Fig. 3a,b, Supplementary Table 3). Conversely, a larger effect size was apparent for TP53 (hazard ratio HR=12.5, 95% CI 5.0-160.5) and U2AF1 (HR=7.9, 95% CI 4.1-192.2) mutations (Fig. 3a,b). However, we note that other ARCH-PD genes such as SRSF2 can contribute a similar relative risk due to their presence at higher VAF in pre-AMLs (Fig. 3a, Extended Data Fig. 5a, Supplementary Note). Of note, mutations in TP53 and spliceosome genes (including U2AF1) are also associated with a poorer prognosis in AML14. As the risk of each ARCH-PD mutations is deleterious and the effect of multiple mutations present in the same individual is multiplicative, a higher number of mutations is predicted to increase AML progression risk (Fig. 3c). Likewise, the size of the largest driver clone was also strongly associated with AML progression risk in agreement with the risk of individual mutations generally being proportional to VAF (Fig. 3c). Collectively, whilst the VAF and mutation number confer much of the predictive value, this model does demonstrate distinct gene-level risk factors, and is able to quantify the cumulative impact of multiple mutations and clonal size on the likelihood of progression to AML.
Figure 3. Model of future AML risk.
a, Forest plot of the risk of AML. Purple, orange and green circles indicate hazard ratios and horizontal lines denote 95% confidence intervals for the combined cohort. For each gene, the indicated hazard ratio applies to the AML risk conferred by each 5% increase in mutation VAF over a 10 year period. The green vertical line indicates the mean HR across all genes. The HR for RUNX1 must to be interpreted with caution due to the relatively high prevalence of deleterious germline variants in this gene, which may not be readily distinguishable from somatic mutations in unmatched sequencing assays (see Methods). The proportion of individuals with mutations in each gene and the average VAF are indicated to the right of the forest plot; red and blue circles represent pre-AMLs and controls, respectively, with circle sizes scaled to reflect mutation frequency and VAF. b-d, Kaplan-Meier curves of AML-free survival, defined as the time between sample collection and AML diagnosis, death or last follow-up. Survival curves are stratified according to mutation status in selected genes (b), number of driver mutations per individual and largest clone detected (c) and red cell distribution width (RDW) (d). Panels a-c represent data for n=796 unique individuals and panel d includes n=299 individuals for whom RDW measurements were available.
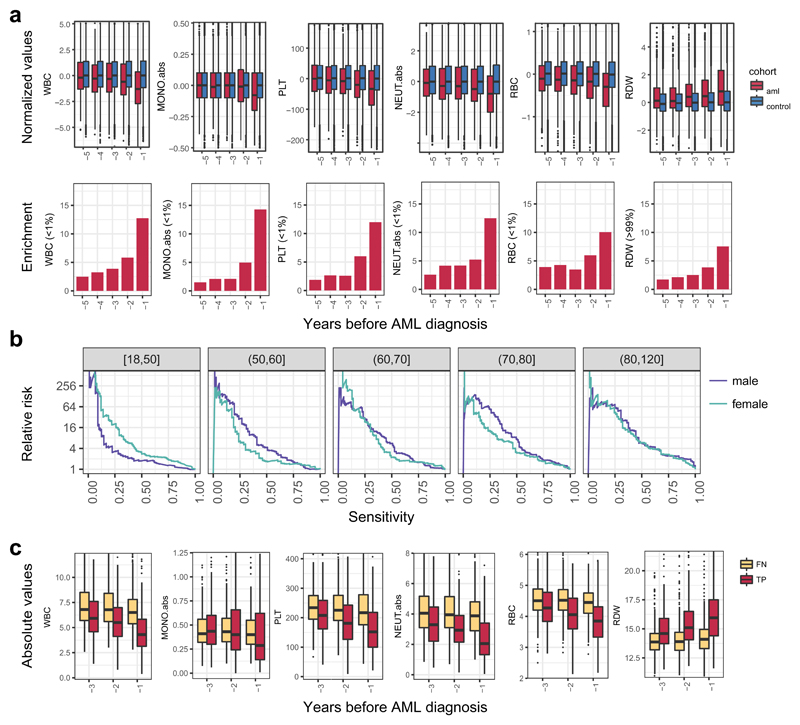
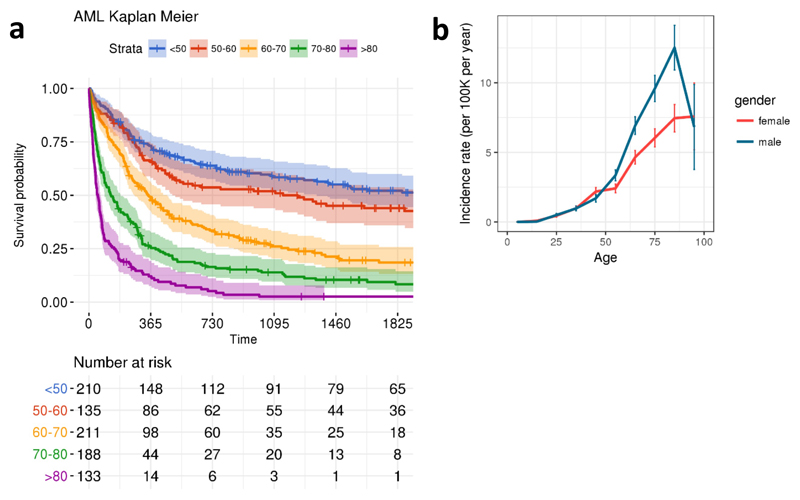
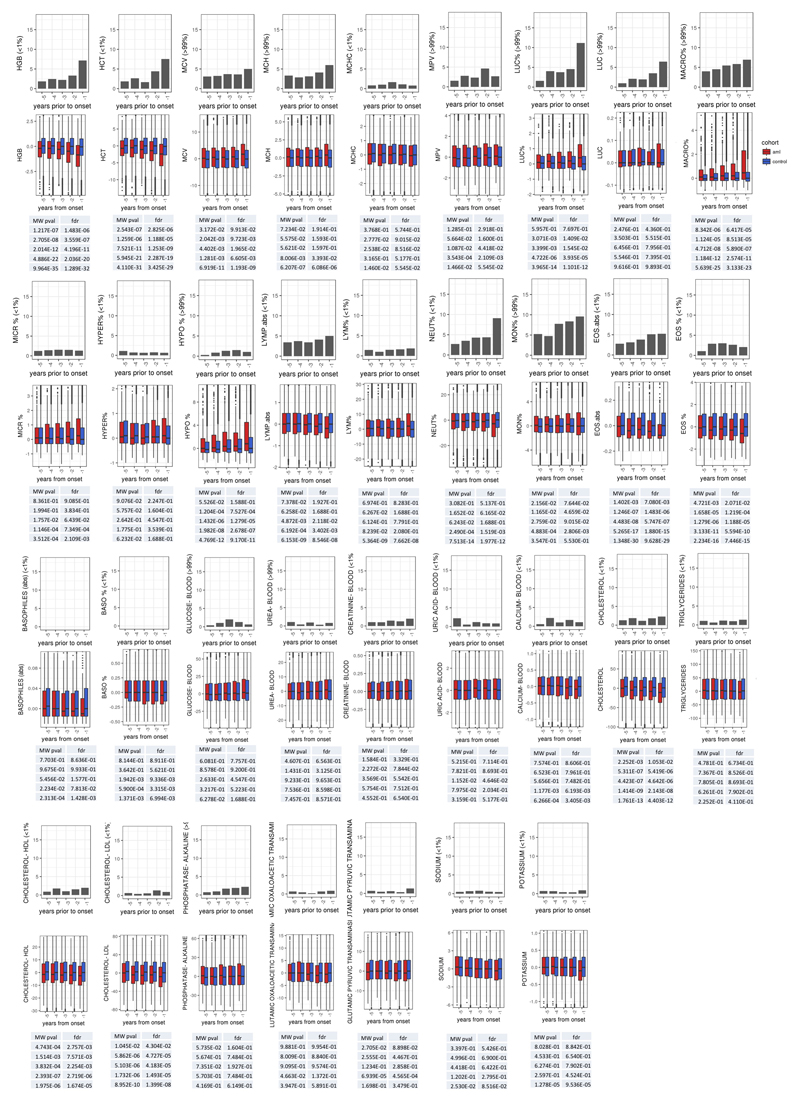
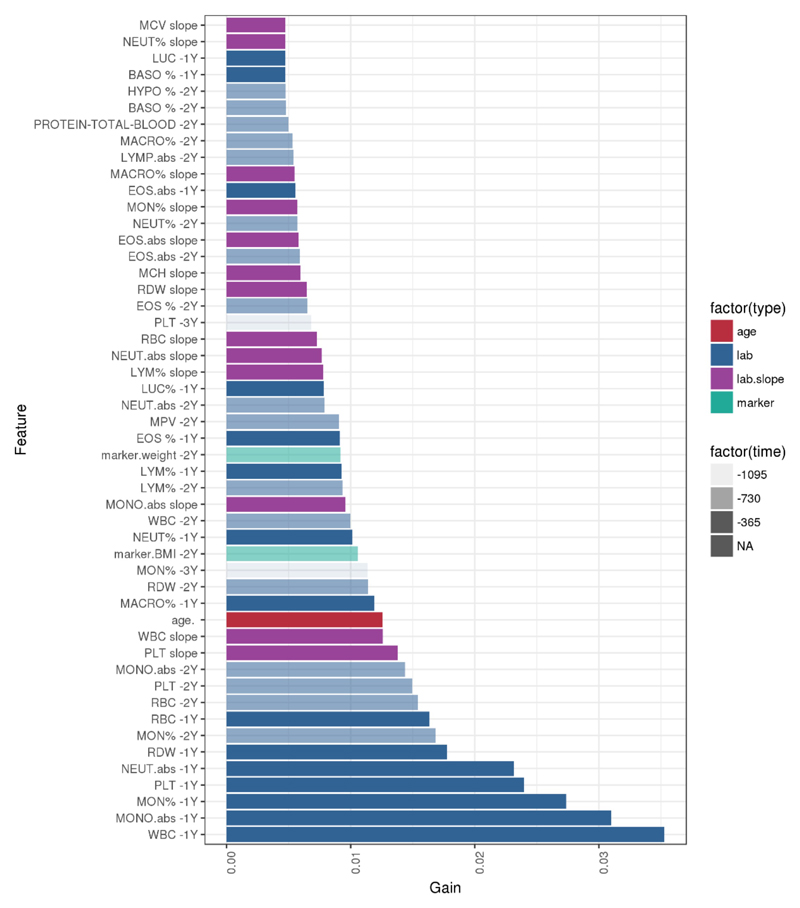
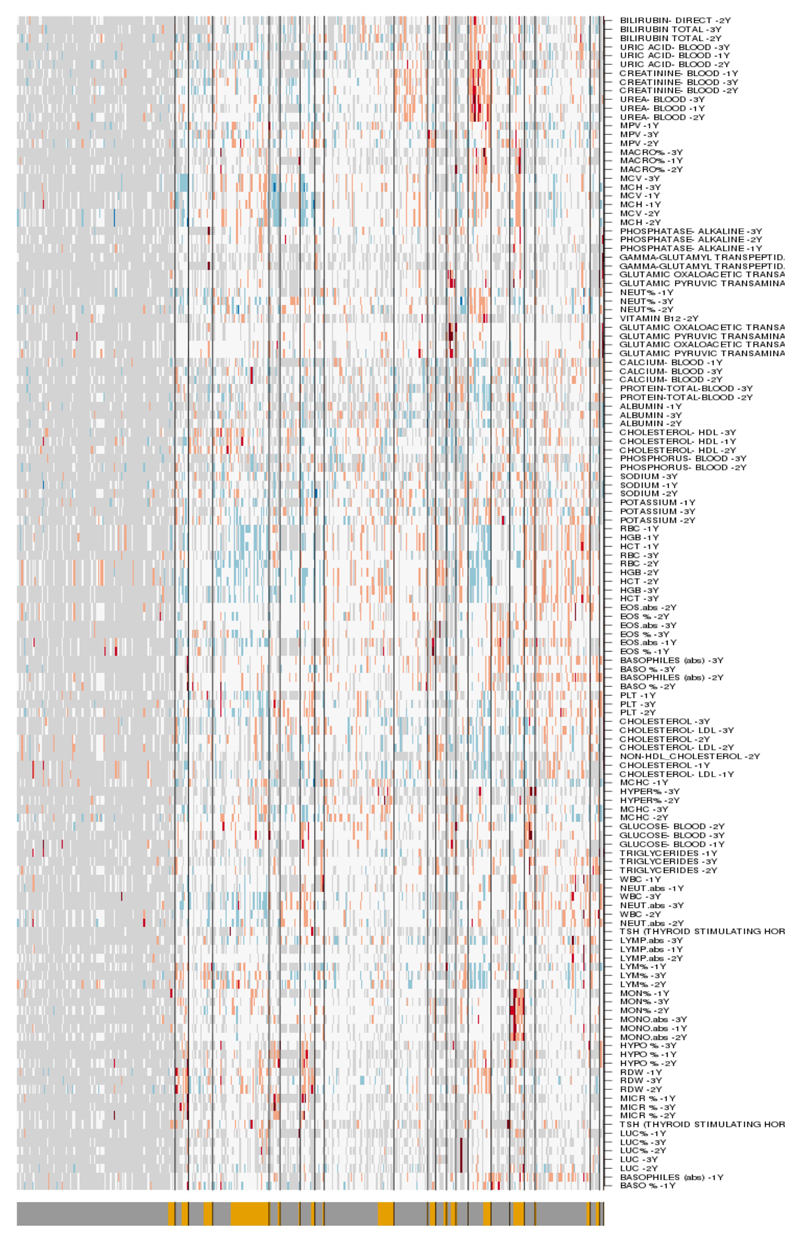
Although our predictive model performs well in identifying those at risk of developing AML in our experimental cohorts, AML incidence rates in the general population are low (4:100,000)1, and thus millions of individuals would need to be screened to identify the few pre-AML cases, with many false positives. We therefore sought to determine whether routinely available clinical information could improve prediction accuracy or identify a high-risk population for targeted genetic screening. We first analysed complete blood count (CBC) and biochemistry data available for 37 of the pre-AMLs and 262 controls. As reported previously5,10,17, ARCH-PD was overwhelmingly associated with normal blood counts and this was also the case for pre-AML cases, indicating that these did not represent undiagnosed myelodysplastic syndromes (MDS)18. We identified a significant association between higher red cell distribution width (RDW) and risk of progression to AML (P=0.0016, Wald Test with Bonferroni multiple testing correction, Fig. 3d). Although traditionally used in the evaluation of anaemia, raised RDW has been correlated with inflammation, ineffective erythropoiesis, cardiovascular disease and adverse outcomes in several inflammatory and malignant conditions19. The correlation between RDW and AML risk remained highly significant when controls without ARCH-PD were excluded from the analysis (P=3.5 x 10-06, Wald test with Bonferroni multiple testing correction, Extended Data Fig. 5b). Higher RDW has previously been associated with ARCH and overall mortality5, but has never been shown to distinguish ARCH from pre-leukaemia. In order to verify RDW as a predictive factor and determine whether additional clinical parameters are associated with AML risk, we studied the Clalit database20, which contains the electronic health records (EHR) with an average of 3.45 million individuals per year collected over a 15-year period21. We identified 875 AML cases using stringent criteria based on diagnostic codes and treatment records (Extended Data Fig. 6, Supplementary Table 4). Analysis of RDW trends revealed significantly raised measurements several years prior to AML diagnosis relative to age and sex-matched controls (Fig. 4a). Additional parameters that correlated with AML risk included reductions in monocyte, platelet, red blood cell and white blood cell counts, albeit usually remaining above the thresholds for clinically relevant cytopenias18 (Fig. 4a, Extended Data Fig. 7). These findings suggest that evolving de novo AML may sometimes have a significant prodrome with subtle but discernible clinical manifestations. We next applied a machine learning approach to construct an AML prediction model based entirely on routinely documented EHR variables (Extended Data Fig. 8, Supplementary Table 4). This model was able to predict AML 6-12 months prior to diagnosis with a sensitivity of 25.7% and overall specificity of 98.2%. The model performed consistently across different age groups with an increased relative risk of 28 and 24 for males and females, respectively, between the age of 60 and 70 years (Fig. 4b). To better understand which patients are most likely to be accurately classified by this model, we compared absolute lab values between true positives (TP) and false negatives (FN). We found that 35.5% of FN predictions were for patients associated with infrequent blood count data (Extended Data Fig. 9). Some of the TP cases had mildly abnormal blood counts that would not initiate a diagnostic work-up (Fig. 4c), and cytopenias that would be compatible with undiagnosed MDS18 were uncommon.
Figure 4. Increased risk for AML development is inferred from electronic health records.
a, Box plot of normalised lab measurements. Increased RDW, reduction in monocyte, platelet, red blood cell and white blood cell counts presented high association (lower panel) with higher AML risk and differed at least a year before AML diagnosis. b, Model performance stratification by age and gender. c, Absolute lab values for true positive (TP) and false negatives (FN) predictions. WBC, white blood cell count; MONO.abs, absolute monocyte count; PLT, platelet count; NEUT.abs, absolute neutrophil count; RBC, red blood cell count; RDW, red cell distribution width. Box plots indicate median, first and third quartiles and 1.5 x interquartile range.
Collectively, our findings provide new insights into the pre-clinical evolution of AML and support the premise that individuals at high risk can be identified years before they develop overt disease. To this end, we present two distinct models for the prediction of de novo AML: one based on somatic point mutations and the other on routinely documented clinical information. We find that basic clinical and laboratory data can identify a high-risk subgroup 6-12 months before AML presentation, whilst genetic information can identify a substantial fraction of cases several years to more than a decade before diagnosis. By characterising features that distinguish benign ARCH from pre-leukaemia, our models give valuable insights into leukaemogenesis. It is evident from the current study, together with our recent analysis of mutation acquisition from pre-leukaemic development through to relapse16, that long-term pre-leukaemic HSPCs frequently carry mutations and undergo significant clonal expansion whilst retaining differentiation capacity for years before AML diagnosis. Furthermore, it is clear that some mutations, particularly those affecting TP53 and U2AF1, impart a relatively high risk of subsequent AML, while mutations in other genes, for example DNMT3A and TET2, confer a lesser risk of malignant transformation. Previous studies suggest that oncogenic mutations in TP53 and spliceosome genes confer little or no competitive advantage in the absence of particular selective pressures22,23, indicating that cell-extrinsic factors may be important determinants of clonal trajectory.
Cancer predictive models have enabled successful early detection and intervention programmes for several solid tumours24,25,26. However, screening tests are unavailable for the sub-clinical stages of most haematological malignancies. Our study provides proof-of-concept for the feasibility of early detection of healthy individuals at high risk of developing AML, and is a first step in the design of future clinical studies to investigate the potential benefits of early interventions in this deadly disease. However, the infrequency of AML necessitates that future screening tests provide high sensitivity and specificity. Our findings suggest that basic clinical data may identify a higher risk population that might benefit from targeted genetic screening. Equally, combining clinical and genetic information in a single model and including structural driver events is likely to improve model accuracy further. Nevertheless, establishing the utility of such a tandem approach will require extensive clinical and genetic analysis on the same population cohort, in a prospective setting. Furthermore, ARCH is associated with several non-malignant conditions4,5, and may play a causal role in cardiovascular disease27,28. Hence genetic testing for ARCH may also prove useful in the management of common age-related diseases. Moreover, this study has broader implications for cancer screening and early intervention beyond AML. Advances in sequencing technologies have revealed a remarkable degree of somatic genetic diversity in normal ageing tissues, often characterised by the presence of clones harbouring canonical oncogenic mutations29. The degree to which clones at high risk of malignant transformation can be reliably distinguished from their indolent counterparts is an important biological question with compelling clinical ramifications. Understanding the selective pressures and cell-intrinsic mechanisms governing clonal fate is the next important step in developing strategies to predict and prevent progression to overt malignancy.
Methods
1. Study participants
Samples for both the DC and VC were ascertained from participants in the EPIC study30. All the relevant ethical regulations were followed. Written informed consent was obtained from all participants in accordance with the Declaration of Helsinki and protocols approved by the relevant ethics committees (IARC Ethics Committee approval #14-31, the Weizmann institute of science Ethics board approval #60-1 and East of England - Cambridgeshire and Hertfordshire Research Ethics Committee reference number 98CN01). AML patients were identified based on the following ICD9 codes: 9861/3 9860/3 9801/3 9866/3 9891/3 9867/3 9874/3 9840/3 9872/3 9895/3 9873/3, which included only cases of de novo AML, and no secondary AML. All patients provided peripheral blood samples from which the buffy coat fractions were separated and aliquoted for long-term storage in liquid nitrogen prior to DNA extraction.
1.1. Discovery cohort
509 DNA samples were collected from individuals upon enrolment into the EPIC study between 1993 and 1998 across 17 different centers30 (Supplementary Table 1). Altogether 95 individuals who developed AML an average of 6.3 years (IQR=4.8 years) after the sample was collected were included in the pre-AML group. 414 age and gender matched individuals were selected for the control group, as they did not develop any hematological disorders during the average follow-up period of 11.6 years (IQR=2.1 years). The median age at recruitment was 56.7 years (range, 36.08 to 74.42). In order to minimize any possible demographic biases, an approximate 1:4.5 pre-AML to control ratio was maintained across the different centres.
1.2. Validation cohort
Samples were ascertained from individuals enrolled in the EPIC-Norfolk longitudinal cohort study between 1994 and 2010. Samples and clinical metadata were available from 37 AML patients (of which 8 were already included in the DC) and 262 age- and gender-matched controls without a history of cancer or any haematological condition. The average time between the first blood sampling and AML diagnosis was 10.5 years (IQR 8.3 years). The averge follow-up period for the control cohort was 17.5 years (IQR 3.8). For 12 individuals in the pre-AML cohort, 2-3 blood specimens were available, taken a median of 3.4 years apart. Of the 262 controls, 141 had multiple blood samples available, spanning a median of 10.5 years. Blood counts and other clinical parameters were available for all study participants (Supplementary Table 1).
2. Targeted sequencing
2.1. Discovery cohort sequencing
Targeted deep sequencing was performed using error-corrected sequencing (ECS) as follows.
Ligation of sequencing adaptors. Shearing of genomic DNA, preparation of pre-capture sequencing libraries, hybridization-based enrichment, assessment of the libraries quality and enrichment following hybridization were performed as previously described31. Briefly, 100ng of genomic DNA was sheared before library construction (KAPA Hyper Prep Kit #KK8504, Kapa Biosystems) with a Covaris E220 instrument using the recommended settings for 250bp fragments. Following End Repair and A-Tailing, adapter ligation was performed using 100-fold molar excess of Molecular Index Adapter. Library clean-up was performed with Agencourt AMPure XP beads (Beckman-Coulter) and the ligated fragments were then amplified for 8 cycles using 0.5μM Illumina universal and indexing primers.
Target capture. Targeted capture was carried out on pools containing 3 indexed libraries. Each pool of adaptor-ligated DNA was combined with 5μl of 1mg/ml Cot-I DNA (Invitrogen), and 1 nmol each of xGEN Universal Blocking Oligo – TS-p5, and xGen Universal Blocking Oligo – TS-p7 (8nt). The mixture was dried using a SpeedVac and then re-suspended in 1.1μl water, 8.5μl NimbleGen 2× hybridization buffer and 3.4μl NimbleGen hybridization component A. The mixture was heat denatured at 95°C for 10 minutes before addition of 4μL of xGen Lockdown Probes (xGen® AML Cancer Panel v1.0, 3pmol). Each pool was then hybridized at 47°C for 72 hr. Washing and recovery of the captured DNA was performed according to the manufacturer’s specifications. Briefly, 100μl of clean streptavidin beads was added to each capture. Following separation and removal of supernatant on a magnet, 200μL 1X Stringent Wash Buffer was added and the reaction was Incubate at 65°C for 5 min. Supernatant containing unbound DNA was removed before repeating the high stringency wash one additional time. Next, the bound DNA was washed as follows: 1) 200μl 1X Wash Buffer I and separation of the supernatants by magnetic separation, 2) 200μl 1X Wash Buffer II following magnetic separation, 3) 200μl 1X Wash Buffer III and removal of the supernatants using magnetic separation. The captured DNA on beads was resuspended in 40μl of Nuclease-Free water before dividing the total volume into 2 PCR tubes and subjecting the libraries to 10 cycles of post-capture amplification (manufacturer recommended conditions; Kapa Biosystems). Prior to sequencing, libraries were spiked in with 2% PhiX.
2.2. Validation cohort sequencing
Targeted sequencing was performed using a custom cRNA bait set (SureSelect, Agilent, UK, ELID #0537771) designed complementary to all coding exons of 111 genes implicated in myeloid leukaemogenesis (Extended Data Table 1). Genomic DNA was extracted from peripheral whole blood and sheared using the Covaris M220. Equimolar pools of 10 libraries were prepared and sequenced on the Illumina HiSeq 2000 using 75 base paired-end sequencing as per Illumina and Agilent SureSelect protocols.
3. Variant calling
3.1. Discover cohort variant calling and error correction
126bp pair-end reads sequencing data from the Illumina platform were converted to fastq format, the 2bp molecular barcode information at each read of the pair was trimmed and was written in the reads’ name. The Thymine nucleotide required for ligation was removed from the sequences. Burroughs-Wheeler Aligner (BWA-mem)32 was used for alignment of the processed fastq files to the reference hg19 genome, following indel-re-alignment using GATK33. An in-house algorithm was written to collapse read families that share the same molecular barcode sequence, the left most genomic position of where each read of the pair maps to the reference and the CIGAR string. Families comprised of at least 2 reads were used to generate consensus reads (CR) and a consensus base was called when there was at least 70% agreement. When a consensus base was called, it was assigned with the maximum base quality score observed in its corresponding pre-collapsed reads. Furthermore, when possible, duplex reads (DR)34 were generated from two CR, from a singleton read (SR) and a CR, or from two SR. For each sequenced sample, we generated two BAM files, called bam1 and bam2. Bam1 one consists of DR, CR and singleton reads, thereby including some error corrected and non-error corrected reads however still containing all the genomic information encoded in the data in the form of unique DNA molecules. Bam2 consists of DR and CR but not singleton reads. Both files were then analysed to detect SNVs and small indels using Varscan235. In order to further remove sequencing artifacts and improve sensitivity, we applied a two-step polishing statistical approach that models the error rate at each sequenced genomic position. For both steps, bam1 was used and all the samples except the sample being investigated were included for error rate modelling. At step one, as previously described31, the error rates were modelled by fitting weibull distribution curves to the non-reference allele fractions. SNVs with allele fractions that were statistically distinguishable from the background error rates (P=0) were further analysed. At Step 2, the coverage of the non-reference allele fractions was considered by using linear line fitting that describes the negative correlation that exist between the log (non-reference allele fraction) and the corresponding log(coverage) values. This allowed us to estimate different error rates at different coverage depths. As indel errors are rare and cannot be appropriately modelled by the same statistical framework they were called using barcode mediated error correction alone. At least 10 CR, 5 supporting reads on the forward strand, 5 supporting reads on the reverse strand, and 2 DR were required to call an indel. Additional post-processing steps applied to data from both the DC and VC are detailed in section 3.3. Variants were annotated using Annovar36.
3.2. Validation cohort variant calling
Sequencing reads were aligned to the reference genome (GRCh37d5) using the Burrows-Wheeler aligner (BWA-aln). Unmapped reads, PCR duplicates and reads mapping to regions outside the target regions (merged exonic regions + 10bp either side of each exon) were excluded from analysis. Sequencing depth at each base was assessed using Bedtools coverage v2.24.037.
Substitutions
Somatic single nucleotide variants (SNVs) were called using shearwater, an algorithm developed for detecting subclonal mutations in deep sequencing experiments (https://github.com/gerstung-lab/deepSNVv1.21.5)38–40 considering only reads with minimum nucleotide and mapping quality of 25 and 40, respectively. This algorithm models the error rate at individual loci using information from multiple unrelated samples. Additionally, allele counts at the recurrent AML mutation hotspots listed in Methods section 4 were generated using an in-house script (https://github.com/cancerit/alleleCount) and manually inspected in the Jbrowse genome browser41. To further complement our SNV calling approach, we applied an extensively validated in-house version of CaVEMan v1.11.2 (Cancer Variants through Expectation Maximization)42. CaVEMan compares sequencing reads between study and nominated normal samples and uses a naïve Bayesian model and expectation-maximization approach to calculate the probability of a somatic variant at each base (https://github.com/cancerit/CaVEMan).
Post-processing filters required that the following criteria were met for CaVEMan to call a somatic substitution:
-
1)
If coverage of the mutant allele was less than 8, at least one mutant allele was detected in the first 2/3 of the read.
-
2)
Less than 3% of the mutant alleles with base quality ≥ 15 were found in the nominated normal sample.
-
3)
Mean mapping quality of the mutant allele reads was ≥ 21.
-
4)
Mutation does not fall in a simple repeat or centromeric region.
-
5)
Fewer than 10% of the reads covering the position contained an indel according to mapping.
-
6)
Less than 80% of the reads report the mutant allele at the same read position.
-
7)
At least a third of the reads calling the variant had a base quality of 25 or higher.
-
8)
Not all mutant alleles reported in the second half of the read.
-
9)
Position does not fall within a germline insertion or deletion.
The following additional post-processing criteria were applied to all SNV calls:
-
1)
Minimum VAF 0.5% with a minimum of 5 bidirectional reporting the mutant allele (with at least 2 reads in forward and reverse directions).
-
2)
No indel called within a read length (75bp) of the putative substitution.
Small insertions and deletions
Small insertions and deletions (indels) were sought using two complementary bioinformatics approaches. Firstly, an in-house version of Pindel v2.243 (https://github.com/cancerit/cgpPindel) was applied. We additionally used the aforementioned deepSNV algorithm in order to increase sensitivity for indels present at low VAF. VAF correction was performed using an in-house script (https://github.com/cancerit/vafCorrect).
Post-processing filters required that the following criteria were met for a variant to be called:
-
1)
Minimum of 5 reads supporting the variant with minimum of 2 reads in each direction. For Pindel, the total read count was based on the union of BWA and Pindel reads reporting the mutant allele.
-
2)
Minimum VAF 0.5%
-
3)
Variant not present within an unmatched normal panel of approximately 400 samples.
-
4)
No reads supporting the variant identified in the nominated normal sample.
Mutations were annotated according to ENSEMBL version 58 using VAGrENT44 for transcript and protein effects (https://github.com/cancerit/VAGrENT) and Annovar36 for additional functional annotation.
3.3. Additional post-processing filters applied to DC and VC data
The following variants were flagged for additional inspection for potential artifacts, germline contamination or index-jumping event:
-
3)
Any mutant allele reported within 75bp of another variant.
-
4)
Any mutant allele with a population allele frequency > 1 in 1000 according to any of five large polymorphism databases: ExAC, 1000 Genomes Project, ESP6500, CG46, Kaviar that is not a canonical hotspot driver mutation with COSMIC recurrence > 100.
-
5)
Mutations that were present in > 10% of the control cohort but not recurrent in COSMIC were flagged as potential germline variants or sequencing artefact.
-
6)
As artifactual indels tend to be recurrent, any indels occurring in >2 samples were flagged as for additional inspection.
4. Curation of oncogenic variants
Putative oncogenic variants were identified according to evidence for functional relevance in AML as previously described and used to define ARCH-PD14.
Variants were annotated as likely driver events if they fulfilled any of the following criteria:
-
1)
Truncating mutations (nonsense, essential splice site or frameshift indel) in the following genes implicated in AML pathogenesis by loss-of-function: NF1, DNMT3A, TET2, IKZF1, RAD21, WT1, KMT2D, SH2B3, TP53, CEBPA, ASXL1, RUNX1, BCOR, KDM6A, STAG2, PHF6, KMT2C.
-
2)
Truncating variants in CALR exon 9.
-
3)
JAK2 V617F
-
4)
FLT3 ITD
-
5)Non-synonymous variants at the following hotspot residues:
- CBL E366, L380, C384, C404, R420, C396
- DNMT3A R882
- FLT3 D835
- IDH1 R132
- IDH2 R172, R140
- KIT W557, V559, D816
- KRAS A146, Q61, G13, G12
- MPL W515
- NRAS Q61, G12, G13
- SF3B1 K700, K666
- SRSF2 P95
- U2AF1 Q157, R156, S34
-
6)
Non-synonymous variants reported at least 10 times in COSMIC with VAF < 42% and population allele frequency < 0.003.
-
7)
Non-synonymous variants clustering within a functionally validated locus or within 4 amino acids of a hotspot variant with population allele frequency < 0.003 and VAF < 42%.
-
8)
Non-synonymous variants reported in COSMIC > 100 times with population allele frequency < 0.003 regardless of VAF.
Our driver curation strategy inevitably runs a small risk of including germline variants in familial AML genes. We feel that in the real world, where a matched constitutional DNA sample would be unavailable, this is the best approach.
5. Statistical analysis
All statistical analyses were performed in the R statistical programming environment. two-sided Wilcoxon rank sum test was used to assign significance level for differences in 1) the median number of somatic mutations among the pre-AML and control groups 2) the median VAF of mutations among groups. 3) The age of individuals with spliceosome mutations. Fisher's exact test was used to assign significance to differences in the prevalence 1) of ARCH among the groups. 2) spliceosome mutation in the pre-AML group
6. Predictive modelling
6.1.1. Cox proportional hazards model with random effects
We used a Cox proportional hazards regression to model AML progression-free survival as previously described14. We used random effects for the Cox proportional hazards model in the CoxHD R package (http://github.com/gerstung-lab/CoxHD). A key strength of this approach is the ability to include many variables in one model while shrinking estimated effects for parameters with weak support in the data, thus controlling for overfitting. We used weighting to minimise the biases introduced by the artificial case-control ratio52,53 and calculated hazard ratios relative to the (approximate) true cumulative incidence of about 1-3/1,000 in the given age range over a follow up of 10-20 years. The observed driver mutation frequency and VAF in pre-AMLs closely resembled values expected based on the estimated risks, indicating that risk model and driver prevalence are well aligned (Extended Data Fig. 4). Full details of model derivation and comparisons with alternative methods are included in the accompanying code (Supplementary Note, also available at https://github.com/gerstung-lab/). In brief, variables comprised age, gender and the variant allele fraction of putative driver mutations (see Methods section 4 for details of variant curation). We performed agnostic imputation of missing variables by mean and linear rescaling of gene variables by a power of 10 to a magnitude of 1. The model was first trained separately on the DC and VC. For each of these two models we evaluated the following measures of predictive accuracy before and after leave-one-out cross-validation (LOOCV): (i) concordance (C)45 and (ii) time-dependent area under the receiver-operating characteristic curve (AUC)46. The models trained on the VC and DC were then cross-validated using the data from the other cohort. In view of the cross-validation results and close correlation between coefficients (Supplementary Table 3), we derived a model on the combined cohorts using both cohorts in order to achieve greater accuracy on the individual effects. Confidence intervals were calculated using 100 bootstrap samples. The coefficients and performance metrics for each iteration of the model are detailed in Supplementary Table 3.
Concordance measures were obtained using the survConcordance() function implemented in the survival R package. Dynamic AUC was calculated with AUC.uno() implemented in the survAUC package. Time-independent AUC was calculated by the performance function implemented in the ROCR package. The expected incidence of AML was calculated from the UK office of national statistics, available at http://www.cancerresearchuk.org/health-professional/cancer-statistics/statistics-by-cancer-type/leukaemia-aml/incidence. All-cause mortality data was obtained from the office of national statistics (https://www.ons.gov.uk/).
6.1.2. Ridge regularised logistic regression
Using the same covariates as in 6.1.1 we fitted ridge regularised logistic regression model to dichotomised outcome data. While logistic regression is a common choice for case-control analyses, a downside of this approach is the inability to explicitly use time-dependent covariates. The penalty parameter was chosen using LOOCV on the full cohort; this value was then used on the DC and VC to yield the same scaling of coefficients. Confidence intervals were calculated using 100 bootstrap samples. Fitting was performed using the glmnet R package. AUC as the primary performance metric was calculated using the ROCR R package.
6.2. Regression models
Two predictive models were developed.
Model 1: This model performs logistic-regression based prediction using four types of features: (1) gender; (2) age at blood sampling; (3) the sum of the VAFs ARCH-PD reported in COSMIC v80 to be recurrent (at least 2 case reports in haematopoietic and lymphoid tissues); and (4) somatic mutation burden of selected genes, where each gene was represented by the sum of the VAFs corresponding to ARCH-PD mutations in that gene. We measured the predictive performance of each gene via the AUC obtained in a 5-fold cross validation when using only the gene as a predictive feature, and only retained genes with AUC>55% in the final model.
Model 2: We applied Lasso regression as implemented in the glmnet R package, while enabling leave-one-out cross-validation to fit a Cox regression model. A minimal subset of ARCH-PD variants was selected whose respective weighted combined VAFs were highly predictive of AML development in the training set. Scores were calculated for each patient as a linear combination of VAF of mutations weighted by regression coefficients that were estimated from the training data. As most scores were zero in the training subset, non-zero scores were discretised to take on a value of 1 that corresponds to AML prediction.
Models 1 and 2 were trained on the DC and tested for their association with AML development using the VC data. Survival analysis was performed using the Kaplan–Meier and Cox proportional hazards models. Wald’s test was used to evaluate the significance of HRs. Logistic regression models were used with the PPV metric to determine the ability of various mutations and other patient parameters to predict AML development. The rms R package was used for logistic regression analysis, while the pROC 1.8 R package was used for ROC curve analysis.
7. EHR-AML predictive model
Clalit database
The Clalit database includes information from patients covered by the Clalit health services in Israel26 during the years 2002-2017. The Clalit train-set data, contains the electronic health records of 3.45 million individuals per year on average. All data was anonymised through hashing of personal identifiers and addresses and randomisation of dates by sampling a random number of weeks for each patient and adding it to all dates in the patient diagnoses, laboratory and medication records. This approach maintained differential data analysis per patient. Diagnoses codes were acquired from both primary care and hospitalisation records, and were mapped to the ICD-9 coding system due to historical reasons, with few exceptions that used a partial ICD-10 coding system. Lab records were normalised for age and gender by subtracting raw test values from the median levels observed among all test values with matching gender and age (using a bin size of 5 years). We observed some chronological biases in lab ranges, but avoid normalising these and instead insured case and controls are matched for chronological distributions.
Defining AML cases
We screened for all active patients (18 < age < 100) that were diagnosed with AML (ICD-9 code 205.0*) between the years 2003 and 2016. We then excluded cases based on the following criteria:
-
1)
We excluded patients with prior myeloid malignancies to omit secondary AML, consistent with the case selection for the genetic model. The following diagnosis were excluded if documented within 5 years prior to the diagnosis of AML: essential thrombocythemia (ICD-9 238.71), low grade myelodysplastic syndrome (MDS) (ICD-9 238.72) high grade MDS lesions (ICD-9 238.73), MDS with 5q deletion (ICD-9 238.74), MDS, unspecified (ICD-9 238.75), polycythemia vera (ICD-9 238.4), myelofibrosis (ICD-9 289.83), chronic myelomonocytic leukemia (CMML) (ICD-9 206.10-206.22)
-
2)
Patients that had any procedures performed on bone marrow or spleen (ICD-10 code Z41) in the 5 years period prior first mention of AML diagnosis code in their record. These patients were presumed to have an inaccurate AML diagnosis date or misdiagnosis recorded.
-
3)Patients that received medications suggestive of an alternative diagnosis of chronic myeloid leukaemia, lymphoid malignancy or acute promyelocytic leukaemia (APL):
- At any time prior to diagnosis: imatinib, dasatinib, anagrelide, hydroxycarbamide, asparaginase, pegaspargase, arsenic trioxide.
- At any time after diagnosis: imatinib, dasatinib, methotrexate, tretinoin, arsenic trioxide.
- At any time after diagnosis, along with any acute lymphoblastic leukaemia (ALL) diagnosis (ICD-9 204) or more than single dose: mercaptopurine.
APL cases were excluded as early diagnosis of APL will most probably not change its outcome, as treatment is successful already.
-
4)
Patients without a hospitalisation record within 3 months prior or 3 months post onset diagnosis. This parameter was used as it is unlikely that an AML patient will not be hospitalised close to diagnosis. This filter reduced false positive cases and better defined the onset date.
We refined the estimated time of onset using the earliest time at which any of the following diagnosis appeared in the patient's history: amyloidosis (ICD-9 277.3), lymphoid leukemia (ICD-9 204), myeloid leukemia (ICD-9 205), leukemia of unspecified cell type (ICD-9 208).
This strategy retained 875 AML cases in the training set for further analysis. These were further validated by manual expert inspection of the complete records of 8 % of the cases.
To define the control set, we included all Clalit individuals that are not cases. Since our analysis was aggregating data from a historical time window of 15 years, we associated each control with a randomised time point for evaluation. Using this approach, both cases and controls represented a specific time point in the historical record of a patient, with matching calendric, age and gender distributions. Through this strategy 5,238,528 controls were used.
Defining features for construction of a predictive a score
We extracted the following features for discriminative analysis of cases and controls (this procedure was applied repeatedly in cross validation as discussed below):
-
-
Age (in years) at time point
-
-
Gender
-
-
Lab features. Out of 2770 different types of lab tests, we selected the top 50 most frequent lab tests (Supplementary Table 4). For each lab measurement, we used median age/gender normalised test values per patient in three time windows ranging from 6-12 months prior to onset, 1-2 years prior to onset and 2-3 years prior to onset. In addition, we compute the slope of the normalised lab measurements in the 6 – 12 month time window using a linear regression model.
Diagnosis features: of the 1780 different major ICD-9 diagnosis codes, we select only diagnosis which were previously observed in at least 10 different cases and have an increased relative risk for AML > 2 fold (as observed on the training set, Supplementary Table 4). For each diagnosis code, we mark whether it appeared in each of the patients in time intervals of 6 months – 3 years, and 3-5 years prior to onset.
-
-
BMI features: for each patient in the cohort we extracted median BMI, weight and height as measured in time intervals of 6 months to 2 years, and 2-3 years prior to onset.
Gradient boosting: We used the R package xgboost to infer parameters for a classifier given cases and controls. Objective was set to binary:logistic, the evaluation metric to AUC. We set nrounds=5000, eta = 0.001, gamma = 0.1, lambda=0.01, alpha=0.01, max_depth=6, min_child_weight=2, subsample=0.7 and colsample_bytree=0.7. The boosting algorithm reports a function f that computes a predictive score given the features. Given a threshold T the expression f(patient features)>T defines a classifier. To standardise thresholds we estimate quantiles for the scores on the train set T(p) = quantile(f(train),p) and define the classifier for specificity level p as f(patient features) > T(p) (Supplementary Table 4).
Cross validation and relative risk evaluation
To evaluate the predictive value of classification scheme while considering the strong age and gender biases in the incidence of AML, we performed five-fold cross validation after splitting the cases and controls to five age and gender matched groups. For each fold, we sampled 100,000 controls and combined with the cases, constructed the feature set and trained the model. The model was then tested on the fold cases along with 200,000 sampled controls. We used standardised classifier parameters and standardised thresholds as inferred based on each train set to generate a series of classifications on each test set and merged these based on the control quantiles in the test as described above. Given a threshold p to define high and low prediction score, we counted for each bin b that defines a patient in a specific age (<40, 40-50, 50-60,60-70,70-80,>80) and gender group:
Nbcase – number of cases in bin, Nbcontrol - number of controls in bin
Nb– number of patient in bin (entire database – recall controls are only a sample of the cohort)
Nb(case, high score) = NbTP = number of true positives (TP)
Nb(case, low score) = NbFN = number of false negatives (FN)
Nb(control, high score) = NbFP = number of false positives (FP)
Nb(control, low score) = NbTN = number of true negatives (TN)
For each age/gender group, the absolute risk for AML in the bin is computed by rbabs= Nbcase/Nb. The absolute risk given high score is estimated rbabs,high = NbTP/ (NbFP+ NbTP). The relative risk in the bin is defined by rrb = rbabs,high/ rbabs, where the sensitivity level for the classifier threshold level is defined as senseb = NbTP/Nbcase.
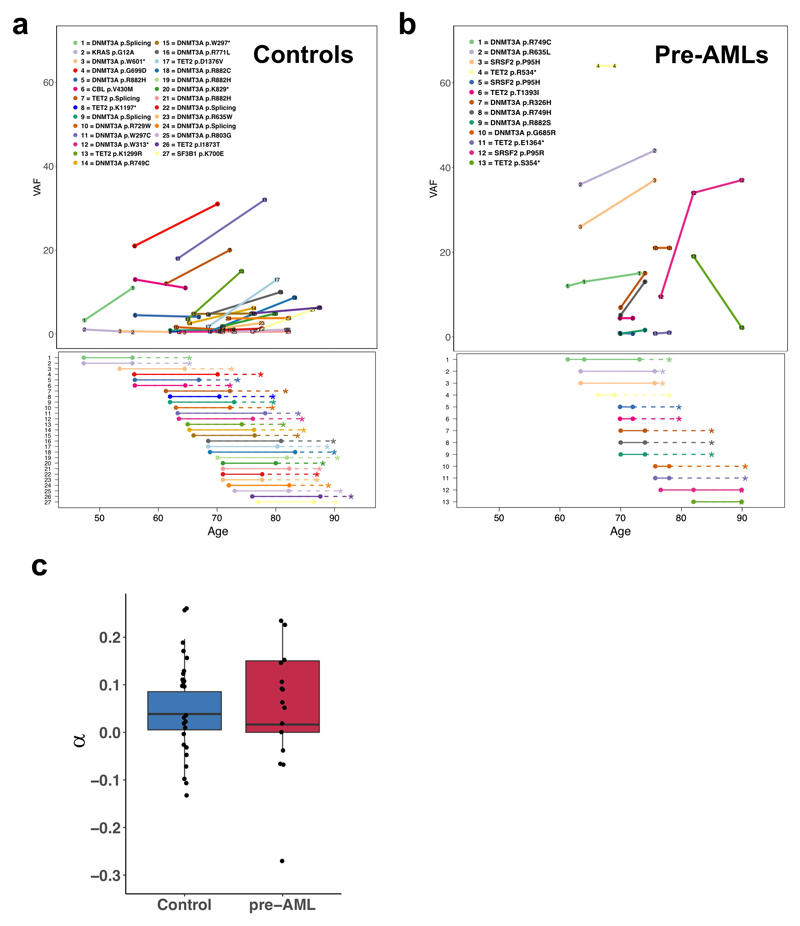
8. Clonal growth rate calculation
Individual clones were defined by different mutations in different study participants. Per each clone we calculated alpha according to the following formula:
α = log (V / V0) / (T - T0)
Where T and T0 indicates the age of the individual at the two measurement time points. V and V0 correspond to the VAF at T and T0 respectively.
Extended Data
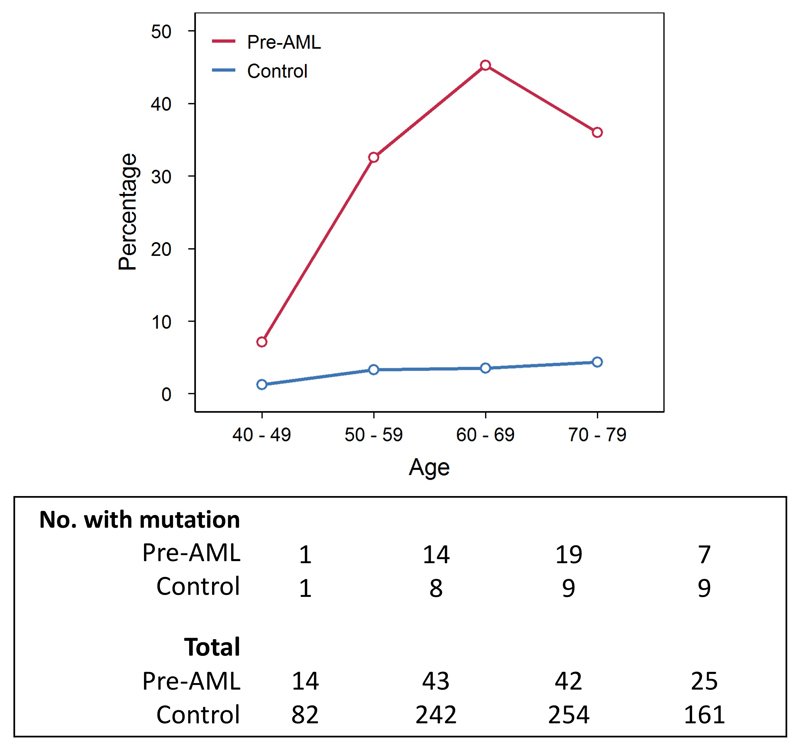
Extended Data Figure 1. Prevalence of ARCH-PD mutations with VAF ≥ 10% according to age.
Red and blue lines represent the proportion of pre-AMLs and controls, respectively, harbouring ARCH-PD mutations with VAF ≥10%.
Extended Data Figure 2. Serial collected sampling supports a long-lived HSPC as the cell of origin for most ARCH-PD clones.
a,b, VAF trajectory of persistent clones carrying putative driver mutations in pre-AML cases (right panel) and controls (left panel). Age is indicated on the x-axis. In the upper panel, VAF is shown on the y-axis and each persistent mutation is shown in a different colour, with circles denoting individual serial samples and solid lines representing the growth trajectory between serial samples. In the lower panel, dashed lines indicate the time interval between the last sampling and the end of follow-up (controls) or AML diagnosis (cases). c, Clonal growth rates (α) are shown for 27 control clones corresponding to 54 time points and 13 pre-AML clones corresponding to 15 time points. Box plots show median and whiskers represent the lower and upper quartiles.
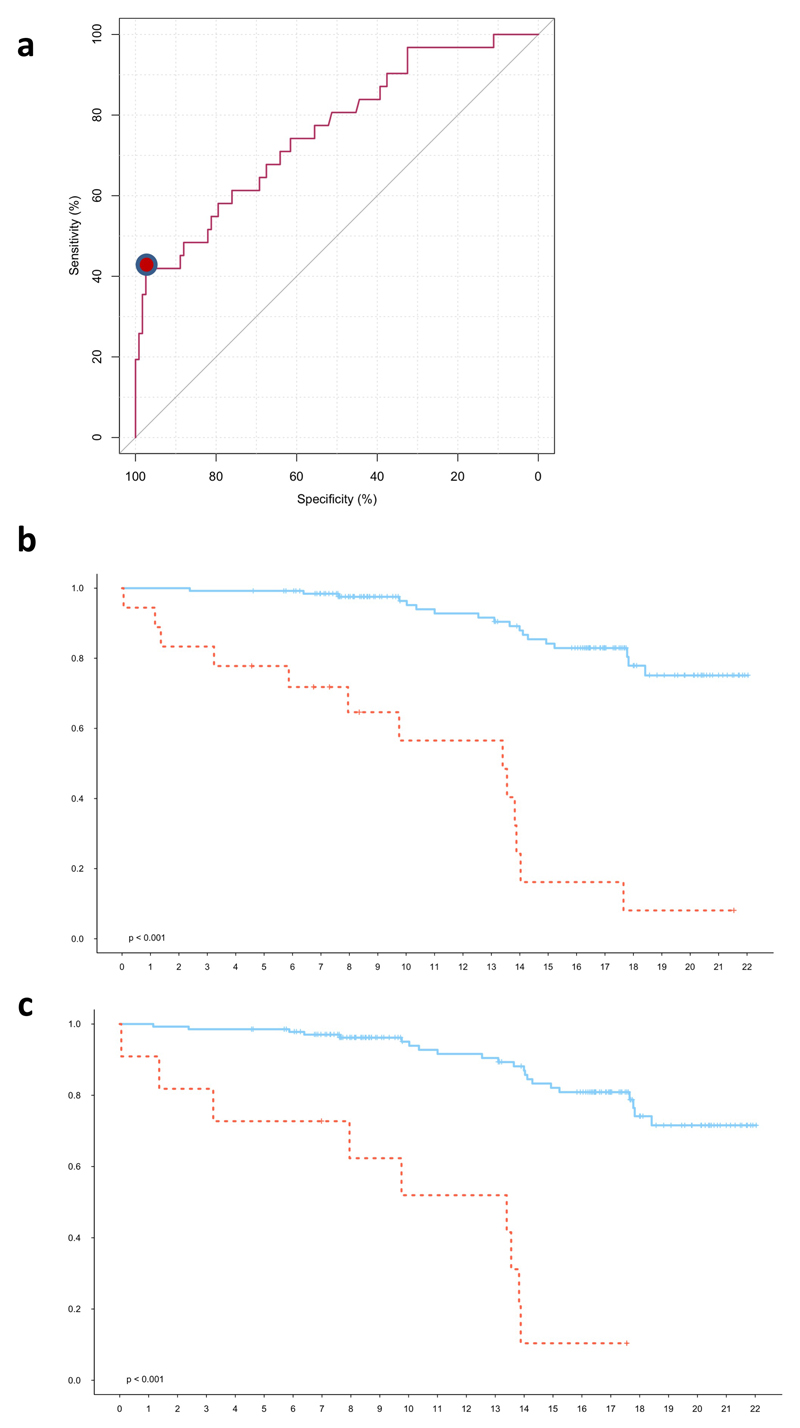
Extended Data Figure 3. Performance of combined model in predicting AML progression.
a, Receiver operating characteristic (ROC) curve for prediction of AML development using model 1 (see Methods). The red dot indicates the point on the curve with the highest positive predictive value (PPV) with sensitivity of 41.9% and specificity of 95.7%. b, Kaplan-Meier estimates of time to AML diagnosis for individuals predicted to develop AML (red) and not develop AML (blue) by model 1 (HR = 10.38, P 4.2e-10 ,Wald test) and c) model 2 (HR = 10.75, P = 1.75e-08, Wald test), from the point of enrolment until the end of follow-up to the EPIC study.
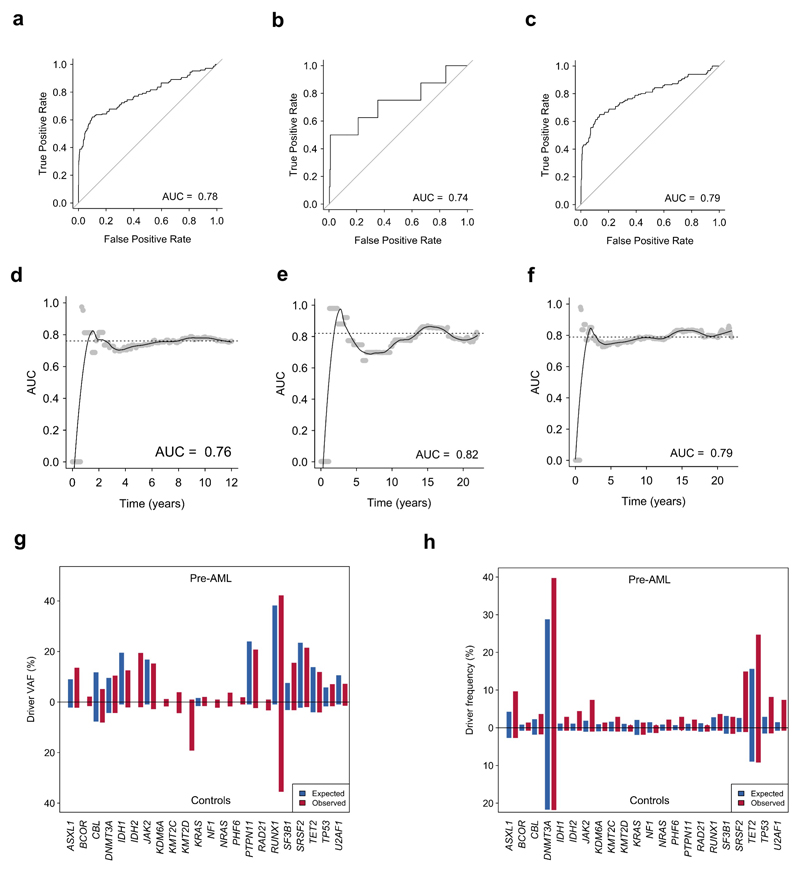
Extended Data Figure 4. AML predictive models.
a,b,c Time-dependent receiver operating characteristic curve for Cox proportional hazards model trained on the DC (a), VC (b) and combined cohorts (c). d,e,f Dynamic AUC for Cox proportional hazards models trained on the DC (d), VC (e) or combined cohort (f). g,h, Red and blue bars indicate the observed and expected VAF (g) and driver frequency (h) for pre-AML cases and controls for each gene indicated on the x-axis. DC, discovery cohort (n = 505 unique individuals); VC, validation cohort (n=291 individuals); ROC, receiver operating characteristic; AUC, area under curve.
Extended Data Figure 5. AML-free survival according to mutation status and RDW.
a, Kaplan-Meier curves of AML-free survival, defined as the time between sample collection and AML diagnosis, death or last follow-up. Survival curves are stratified according to mutation status in genes mutated in at least 3 samples across the combined validation and discovery cohorts. N=796 unique individuals. b, Kaplan-Meier curve of AML-free survival stratified according to RDW value >14 or ≤14. Plot represents data for N=128 biologically independent individuals with RDW measurements recorded, including all pre-AMLs regardless of ARCH-PD status, and controls with ARCH-PD (controls without detectable mutations omitted). RDW, red cell distribution width.
Extended Data Figure 6. Description of the cohort and the EHR derived measurements.
a, Kaplan-Meier curves showing age stratified survival rates for 875 individuals who developed AML. b, Line plot representation of the number of cases per 100,000 control individuals in the EHR database. The centre values and error bars define the average and s.d respectively
Extended Data Figure 7. Laboratory measurements contributing to EHR model.
Box plot of normalized lab measurements (upper panels) and their association (lower panel) with higher AML risk. Box plots show median and whiskers represent the lower and upper quartiles
Extended Data Figure 8. Top 50 EHR model parameters.
Bar chart showing the relative contribution of the top 50 features incorporated into the EHR prediction model, ranked according to their predictive value (gain).
Extended Data Figure 9. Distribution of EHR model parameters.
Heat-map illustrating absolute values of clinical measurements. Blue, white and red represent low, intermediate and high values, respectively. Light grey represents missing data. FN and TP annotation is indicated on the lower bar as dark-grey and yellow color respectively. FN, false negative; TP, false positive; EHR, electronic health record.
Extended Data table 1.
Genes sequenced by cRNA bait pulldown in the validation cohort.
| GNB1 | FBXW7 | CUL2 | RAD51 | CBLC |
| CSF3R | IRF1 | CDH23 | IDH2 | U2AF2 |
| MPL | CSF1R | PTEN | CREBBP | ASXL1 |
| NRAS | NPM1 | SMC3 | SMG1 | PTPRT |
| NOTCH2 | PHACTR1 | HRAS | CBFB | GNAS |
| RIT1 | DAXX | WT1 | CTCF | RUNX1 |
| CACNA1E | PHIP | SF1 | SMPD3 | U2AF1 |
| FAM5C | MYB | EED | PRPFB | CSF2RB |
| DNMT3A | FNDC1 | CNTNS | TP53 | CBX7 |
| ASXL2 | CUX1 | MLL | NF1 | EP300 |
| SF3B1 | MLL5 | CBL | SUZ12 | ZRSR2 |
| IDH1 | LUC7L2 | ETV6 | STAT5B | BCOR |
| CUL3 | BRAF | KRAS | KANSL1 | KDM6A |
| GIGYF2 | CUL1 | MLL2 | DCAF7 | GATA1 |
| CBLB | EZH2 | PRPF40B | SRSF2 | SMC1A |
| GATA2 | MLL3 | PPFIA2 | ASXL3 | PHF8 |
| STAG1 | RAD21 | SH2B3 | SETBP1 | MED12 |
| PIK3CA | MYC | PTPN11 | DNMT1 | ATRX |
| FRYL | JAK2 | FLT3 | EPOR | RPS6KA6 |
| KIT | CDKN2A | PDS5B | JAK3 | DIAPH2 |
| UGT2A3 | HNRNPK | DCLK1 | CEBPA | STAG2 |
| TET2 | NOTCH1 | RB1 | ZFP36 | PHF6 |
Supplementary Material
Acknowledgements
This work was supported by Quest for cure grant to L.I.S., J.C.Y.W. and M.D.M. from the Leukemia and Lymphoma Society, and the following grants to L.I.S from: ERC Horizon 2020 MAMLE, Abisch-Frenkel foundation and an American Society of Hematology Scholar Award. Further funding to J.E.D. was provided by the Canada Research Chair Program, Ontario Institute for Cancer Research, the province of Ontario, Canadian Cancer Society, the Canadian Institutes for Health Research and the Ontario Ministry of Health and Long Term Care to UHN, whose views are not expressed here. Work conducted at the Sanger Institute was supported by the Wellcome Trust and UK Medical Research Council. S.A. was personally funded by the Benjamin Pearl fellowship from the McEwen Centre for Regenerative Medicine, G.C. by a Wellcome Trust Clinical PhD Fellowship (WT098051); G.S.V. by a Wellcome Trust Senior Fellowship in Clinical Science (WT095663MA) and a Cancer Research UK Senior Cancer Research Fellowship (C22324/A23015). We thank Amanda Mitchell and all the members of the Dick and Shlush laboratories for comments and Tom Hudson for early study planning. We thank Gabi Barabash for organising the Clalit dataset collaboration. The EPIC study centers were supported by the Hellenic Health Foundation, Regional Government of Asturias, the Regional Government of Murcia (no. 6236), the Spanish Ministry of Health network RTICCC (ISCIII RD12/0036/0018), FEDER funds /European Regional Development Fund (ERDF), "a way to build Europe”, Generalitat de Catalunya, AGAUR 2014SGR726; EPIC Ragusa in Italy-Aire-Onlus Ragusa; Epic Italy-Associazione Italiana per la Ricerca sul Cancro (AIRC) Milan, Italy. S.V.B. and T.J.P are supported by the Gattuso-Slaight Personalized Cancer Medicine Fund at the Princess Margaret Cancer Centre.
Footnotes
Data availability
Discovery cohort targeted sequencing BAM files data will be deposited at the European Genome-phenome Archive (http://www.ebi.ac.uk/ega/) under accession number EGAD00001003583. All other data are available from the corresponding author upon reasonable request. Validation cohort sequencing data is deposited at the European Genome Phenome Archive with accession number EGAD00001003703. Code for derivation of the prediction model is publically available on Github (https://github.com/gerstung-lab/preAML). Code for the analysis of ECS is publically available through Protocol exchange under the name “Identification of somatic mutations from targeted and barcoded sequencing data”.
Author contribution
S.W.K.N., O.W., N.M.C., and E.N. contributed equally to the work. S.A. performed error-corrected sequencing, analysed sequencing data, performed statistical analyses, contributed to genetic predictive model derivation and wrote the manuscript. G.C. performed variant calling, statistical analyses, derived genetic predictive models and wrote the manuscript. M.G., S.W.K.N., O.W. and R.C derived genetic predictive models. N.M.C., E.N. and N.B. derived the clinical prediction model. P.C.Z., Z.Z., I.C., K.N., C.L., C.H., D.H., F.M., J.E., J.M., D.P., L.T., P.K., S.V.B. and A.B. provided sequencing and technical support and enabled sample acquisition. L.H., Y.S., T.T.W., T.J.P., K.R. and D.J. provided bioinformatics support. R.L., S.H., M.J., K.M.B., A.K. and N.J.W. enabled sample acquisition, clinical data curation and/or provided clinical expertise. D.S., J.D.M., P.A., E.S., S.B., Ph.Be and I.M. contributed to data analysis and interpretation. P.J.C. and E.P. contributed to data interpretation and designed the targeted sequencing assay for the validation cohort. J.C.Y.W. revised the manuscript. J.R.Q., A.Ka., A.Kr., C.L.V., A.T., E.S.F., J.M.H., R.C.T., R.T., G.M., H.B., S.Pa., R.K., S.S., S.Po., N.W., N.S., K.T.K., M.F., J.M.K., E.R., P.V. and R.V. enabled sample acquisition (EPIC). A.T. and R.D.B. analysed Clalit data and derived clinical prediction model. M.G. derived predictive genetic models, contributed to sequencing data analysis and manuscript writing. J.E.D. contributed to funding applications, study supervision, manuscript writing. P.Br. supervised sample acquisition from all the EPIC centres. G.S.V., L.I.S. designed and supervised all aspects of the study and wrote the manuscript.
Competing interests
The authors declare no competing financial interests.
References
- 1.Deschler B, Lubbert M. Acute myeloid leukemia: epidemiology and etiology. Cancer. 2006;107:2099–2107. doi: 10.1002/cncr.22233. [DOI] [PubMed] [Google Scholar]
- 2.Corces-Zimmerman MR, Hong WJ, Weissman IL, Medeiros BC, Majeti R. Preleukemic mutations in human acute myeloid leukemia affect epigenetic regulators and persist in remission. Proc Natl Acad Sci U S A. 2014;111:2548–2553. doi: 10.1073/pnas.1324297111. [DOI] [PMC free article] [PubMed] [Google Scholar]
- 3.Shlush LI, et al. Identification of pre-leukaemic haematopoietic stem cells in acute leukaemia. Nature. 2014;506:328–333. doi: 10.1038/nature13038. [DOI] [PMC free article] [PubMed] [Google Scholar]
- 4.Genovese G, et al. Clonal hematopoiesis and blood-cancer risk inferred from blood DNA sequence. N Engl J Med. 2014;371:2477–2487. doi: 10.1056/NEJMoa1409405. [DOI] [PMC free article] [PubMed] [Google Scholar]
- 5.Jaiswal S, et al. Age-related clonal hematopoiesis associated with adverse outcomes. N Engl J Med. 2014;371:2488–2498. doi: 10.1056/NEJMoa1408617. [DOI] [PMC free article] [PubMed] [Google Scholar]
- 6.Xie M, et al. Age-related mutations associated with clonal hematopoietic expansion and malignancies. Nat Med. 2014 doi: 10.1038/nm.3733. [DOI] [PMC free article] [PubMed] [Google Scholar]
- 7.Busque L, et al. Nonrandom X-inactivation patterns in normal females: lyonization ratios vary with age. Blood. 1996;88:59–65. [PubMed] [Google Scholar]
- 8.Shlush LI. Age related clonal hematopoiesis (ARCH) Blood. 2017 doi: 10.1182/blood-2017-07-746453. [DOI] [PubMed] [Google Scholar]
- 9.Acuna-Hidalgo R, et al. Ultra-sensitive Sequencing Identifies High Prevalence of Clonal Hematopoiesis-Associated Mutations throughout Adult Life. Am J Hum Genet. 2017;101:50–64. doi: 10.1016/j.ajhg.2017.05.013. [DOI] [PMC free article] [PubMed] [Google Scholar]
- 10.McKerrell T, et al. Leukemia-associated somatic mutations drive distinct patterns of age-related clonal hemopoiesis. Cell Rep. 2015;10:1239–1245. doi: 10.1016/j.celrep.2015.02.005. [DOI] [PMC free article] [PubMed] [Google Scholar]
- 11.Wong TN, Ramsingh G, Young AL. Role of TP53 mutations in the origin and evolution of therapy-related acute myeloid leukaemia. Nature. 2014 doi: 10.1038/nature13968. [DOI] [PMC free article] [PubMed] [Google Scholar]
- 12.Yoshizato T, et al. Somatic Mutations and Clonal Hematopoiesis in Aplastic Anemia. N Engl J Med. 2015;373:35–47. doi: 10.1056/NEJMoa1414799. [DOI] [PMC free article] [PubMed] [Google Scholar]
- 13.Kronke J, et al. Clonal evolution in relapsed NPM1-mutated acute myeloid leukemia. Blood. 2013;122:100–108. doi: 10.1182/blood-2013-01-479188. [DOI] [PubMed] [Google Scholar]
- 14.Papaemmanuil E, et al. Genomic Classification and Prognosis in Acute Myeloid Leukemia. N Engl J Med. 2016;374:2209–2221. doi: 10.1056/NEJMoa1516192. [DOI] [PMC free article] [PubMed] [Google Scholar]
- 15.Forbes SA, et al. COSMIC: somatic cancer genetics at high-resolution. Nucleic Acids Res. 2017;45:D777–D783. doi: 10.1093/nar/gkw1121. [DOI] [PMC free article] [PubMed] [Google Scholar]
- 16.Shlush LI, et al. Tracing the origins of relapse in acute myeloid leukaemia to stem cells. Nature. 2017 doi: 10.1038/nature22993. [DOI] [PubMed] [Google Scholar]
- 17.Buscarlet M, et al. DNMT3A and TET2 dominate clonal hematopoiesis and demonstrate benign phenotypes and different genetic predispositions. Blood. 2017;130:753–762. doi: 10.1182/blood-2017-04-777029. [DOI] [PubMed] [Google Scholar]
- 18.Arber DA, et al. The 2016 revision to the World Health Organization classification of myeloid neoplasms and acute leukemia. Blood. 2016;127:2391–2405. doi: 10.1182/blood-2016-03-643544. [DOI] [PubMed] [Google Scholar]
- 19.Hu L, et al. Prognostic value of RDW in cancers: a systematic review and meta-analysis. Oncotarget. 2017;8:16027–16035. doi: 10.18632/oncotarget.13784. [DOI] [PMC free article] [PubMed] [Google Scholar]
- 20.Balicer RD, Afek A. Digital health nation: Israel's global big data innovation hub. Lancet. 2017;389:2451–2453. doi: 10.1016/S0140-6736(17)30876-0. [DOI] [PubMed] [Google Scholar]
- 21.Dagan N, Cohen-Stavi C, Leventer-Roberts M, Balicer RD. External validation and comparison of three prediction tools for risk of osteoporotic fractures using data from population based electronic health records: retrospective cohort study. BMJ. 2017;356:i6755. doi: 10.1136/bmj.i6755. [DOI] [PMC free article] [PubMed] [Google Scholar]
- 22.Wong TN, et al. Role of TP53 mutations in the origin and evolution of therapy-related acute myeloid leukaemia. Nature. 2015;518:552–555. doi: 10.1038/nature13968. [DOI] [PMC free article] [PubMed] [Google Scholar]
- 23.McKerrell T, Vassiliou GS. Aging as a driver of leukemogenesis. Sci Transl Med. 2015;7 doi: 10.1126/scitranslmed.aac4428. 306fs338. [DOI] [PMC free article] [PubMed] [Google Scholar]
- 24.Vickers AJ. Prediction models in cancer care. CA Cancer J Clin. 2011;61:315–326. doi: 10.3322/caac.20118. [DOI] [PMC free article] [PubMed] [Google Scholar]
- 25.Cassidy A, et al. The LLP risk model: an individual risk prediction model for lung cancer. Br J Cancer. 2008;98:270–276. doi: 10.1038/sj.bjc.6604158. [DOI] [PMC free article] [PubMed] [Google Scholar]
- 26.Wang X, Oldani MJ, Zhao X, Huang X, Qian D. A review of cancer risk prediction models with genetic variants. Cancer Inform. 2014;13:19–28. doi: 10.4137/CIN.S13788. [DOI] [PMC free article] [PubMed] [Google Scholar]
- 27.Fuster JJ, et al. Clonal hematopoiesis associated with TET2 deficiency accelerates atherosclerosis development in mice. Science. 2017;355:842–847. doi: 10.1126/science.aag1381. [DOI] [PMC free article] [PubMed] [Google Scholar]
- 28.Jaiswal S, et al. Clonal Hematopoiesis and Risk of Atherosclerotic Cardiovascular Disease. N Engl J Med. 2017 doi: 10.1056/NEJMoa1701719. [DOI] [PMC free article] [PubMed] [Google Scholar]
- 29.Martincorena I, Campbell PJ. Somatic mutation in cancer and normal cells. Science. 2015;349:1483–1489. doi: 10.1126/science.aab4082. [DOI] [PubMed] [Google Scholar]
- 30.Riboli E, et al. European Prospective Investigation into Cancer and Nutrition (EPIC): study populations and data collection. Public Health Nutr. 2002;5:1113–1124. doi: 10.1079/PHN2002394. [DOI] [PubMed] [Google Scholar]
- 31.Newman AM, et al. An ultrasensitive method for quantitating circulating tumor DNA with broad patient coverage. Nat Med. 2014;20:548–554. doi: 10.1038/nm.3519. [DOI] [PMC free article] [PubMed] [Google Scholar]
- 32.Li H, Durbin R. Fast and accurate long-read alignment with Burrows-Wheeler transform. Bioinformatics. 2010;26:589–595. doi: 10.1093/bioinformatics/btp698. [DOI] [PMC free article] [PubMed] [Google Scholar]
- 33.McKenna A, et al. The Genome Analysis Toolkit: a MapReduce framework for analyzing next-generation DNA sequencing data. Genome Res. 2010;20:1297–1303. doi: 10.1101/gr.107524.110. [DOI] [PMC free article] [PubMed] [Google Scholar]
- 34.Kennedy SR, et al. Detecting ultralow-frequency mutations by Duplex Sequencing. Nat Protoc. 2014;9:2586–2606. doi: 10.1038/nprot.2014.170. [DOI] [PMC free article] [PubMed] [Google Scholar]
- 35.Koboldt DC, et al. VarScan 2: somatic mutation and copy number alteration discovery in cancer by exome sequencing. Genome Res. 2012;22:568–576. doi: 10.1101/gr.129684.111. [DOI] [PMC free article] [PubMed] [Google Scholar]
- 36.Yang H, Wang K. Genomic variant annotation and prioritization with ANNOVAR and wANNOVAR. Nat Protoc. 2015;10:1556–1566. doi: 10.1038/nprot.2015.105. [DOI] [PMC free article] [PubMed] [Google Scholar]
- 37.Quinlan AR, Hall IM. BEDTools: a flexible suite of utilities for comparing genomic features. Bioinformatics. 2010;26:841–842. doi: 10.1093/bioinformatics/btq033. [DOI] [PMC free article] [PubMed] [Google Scholar]
- 38.Gerstung M, et al. Reliable detection of subclonal single-nucleotide variants in tumour cell populations. Nat Commun. 2012;3:811. doi: 10.1038/ncomms1814. [DOI] [PubMed] [Google Scholar]
- 39.Gerstung M, et al. Precision oncology for acute myeloid leukemia using a knowledge bank approach. Nat Genet. 2017;49:332–340. doi: 10.1038/ng.3756. [DOI] [PMC free article] [PubMed] [Google Scholar]
- 40.Martincorena I, et al. Tumor evolution. High burden and pervasive positive selection of somatic mutations in normal human skin. Science. 2015;348:880–886. doi: 10.1126/science.aaa6806. [DOI] [PMC free article] [PubMed] [Google Scholar]
- 41.Buels R, et al. JBrowse: a dynamic web platform for genome visualization and analysis. Genome Biol. 2016;17:66. doi: 10.1186/s13059-016-0924-1. [DOI] [PMC free article] [PubMed] [Google Scholar]
- 42.Stephens PJ, et al. The landscape of cancer genes and mutational processes in breast cancer. Nature. 2012;486:400–404. doi: 10.1038/nature11017. [DOI] [PMC free article] [PubMed] [Google Scholar]
- 43.Raine KM, et al. cgpPindel: Identifying Somatically Acquired Insertion and Deletion Events from Paired End Sequencing. Curr Protoc Bioinformatics. 2015;52 doi: 10.1002/0471250953.bi1507s52. 15 17 11-12. [DOI] [PMC free article] [PubMed] [Google Scholar]
- 44.Menzies A, et al. VAGrENT: Variation Annotation Generator. Curr Protoc Bioinformatics. 2015;52 doi: 10.1002/0471250953.bi1508s52. 15 18 11-11. [DOI] [PMC free article] [PubMed] [Google Scholar]
- 45.Harrell FE, Jr, Lee KL, Mark DB. Multivariable prognostic models: issues in developing models, evaluating assumptions and adequacy, and measuring and reducing errors. Stat Med. 1996;15:361–387. doi: 10.1002/(SICI)1097-0258(19960229)15:4<361::AID-SIM168>3.0.CO;2-4. [DOI] [PubMed] [Google Scholar]
- 46.O'Quigley J, Xu R, Stare J. Explained randomness in proportional hazards models. Stat Med. 2005;24:479–489. doi: 10.1002/sim.1946. [DOI] [PubMed] [Google Scholar]
Associated Data
This section collects any data citations, data availability statements, or supplementary materials included in this article.


