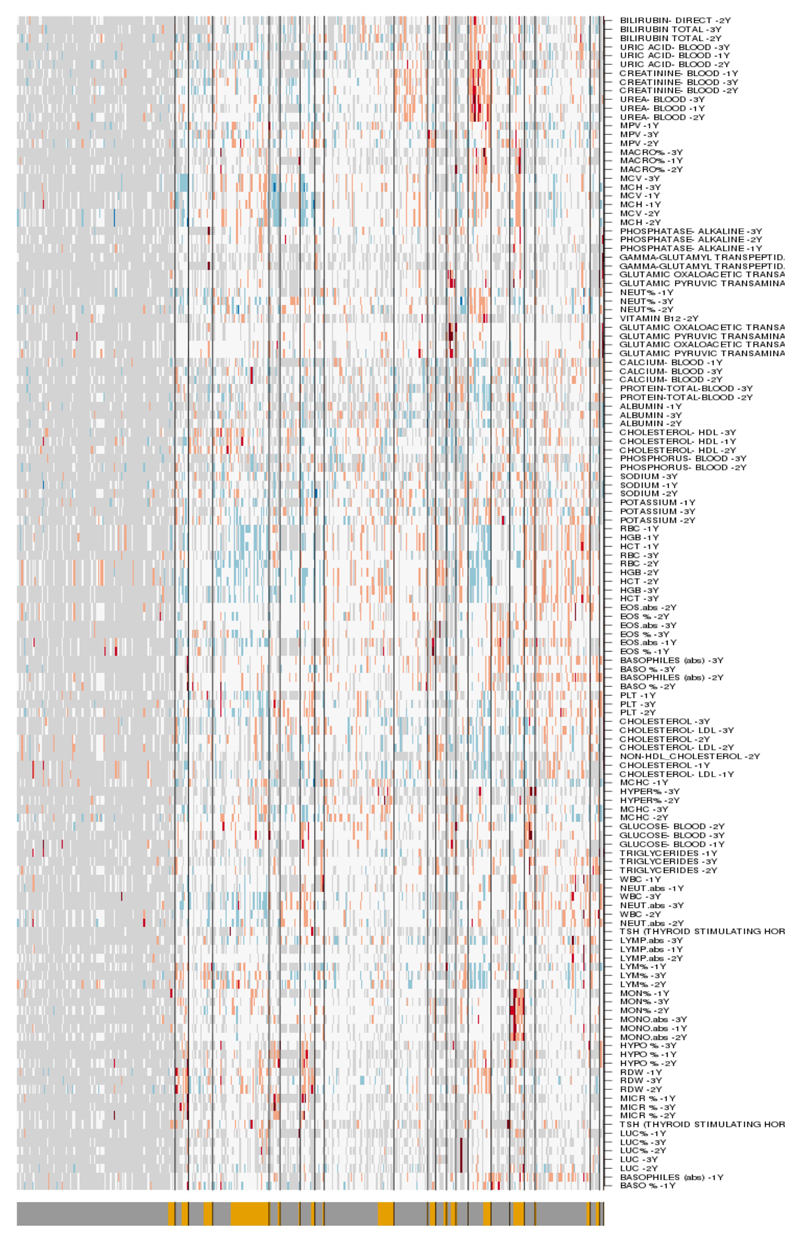
Extended Data Figure 9. Distribution of EHR model parameters.
Heat-map illustrating absolute values of clinical measurements. Blue, white and red represent low, intermediate and high values, respectively. Light grey represents missing data. FN and TP annotation is indicated on the lower bar as dark-grey and yellow color respectively. FN, false negative; TP, false positive; EHR, electronic health record.

