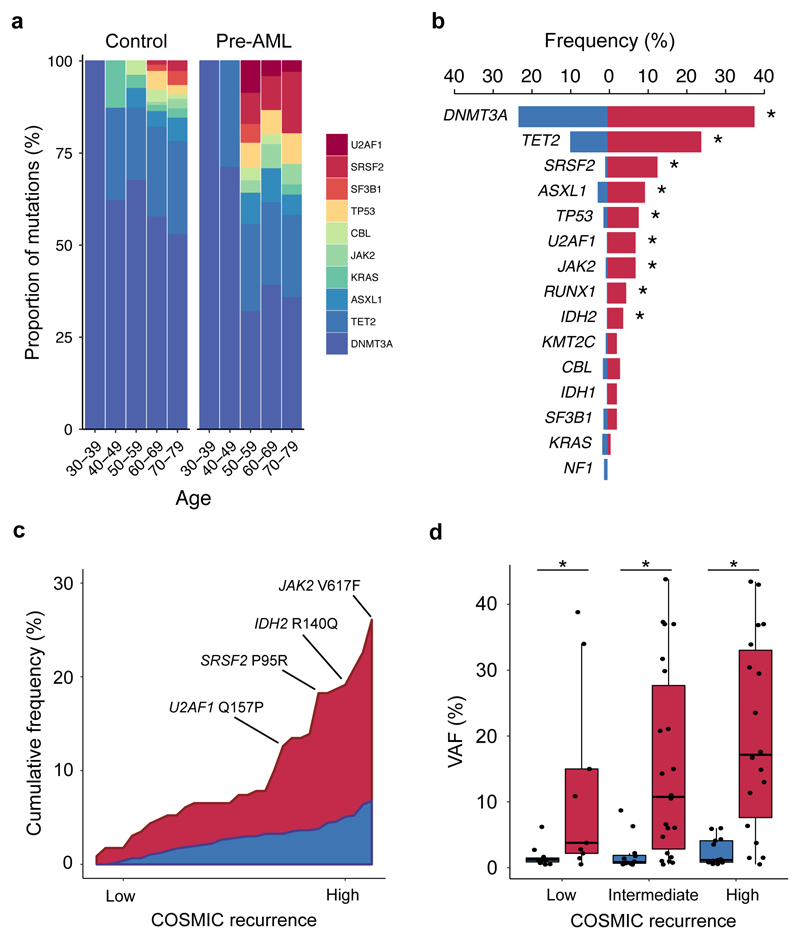
Figure 2. Acquisition of specific recurrent AML mutations by healthy individuals at young age is associated with progression to AML.
a, Relative frequency of mutations in the indicated genes according to age group for pre-AMLs (red) and controls (blue). b, Proportion of pre-AML cases and controls harbouring ARCH-PD mutations in recurrently mutated genes. Asterisks (*) indicate P<0.05 (Fisher’s exact test with Bonferroni multiple testing correction). c, Plot showing the cumulative frequency of recurrent AML mutations (reported in >5 specimens in COSMIC) in pre-AML cases and controls. ARCH-PD mutations are ranked from left to right along the x-axis from low to high recurrence. d, VAF of recurrent mutations in cases and controls. Low, intermediate and highly recurrent COSMIC mutations are defined as those reported in 5-19 samples, 20-300 samples and >300 samples, respectively. Box plots indicate median, first and third quartiles and 1.5 x interquartile range. P-values were calculated by two-sided Wilcoxon rank sum test with Bonferroni multiple testing correction. All panels show data for n=800 unique individuals.

