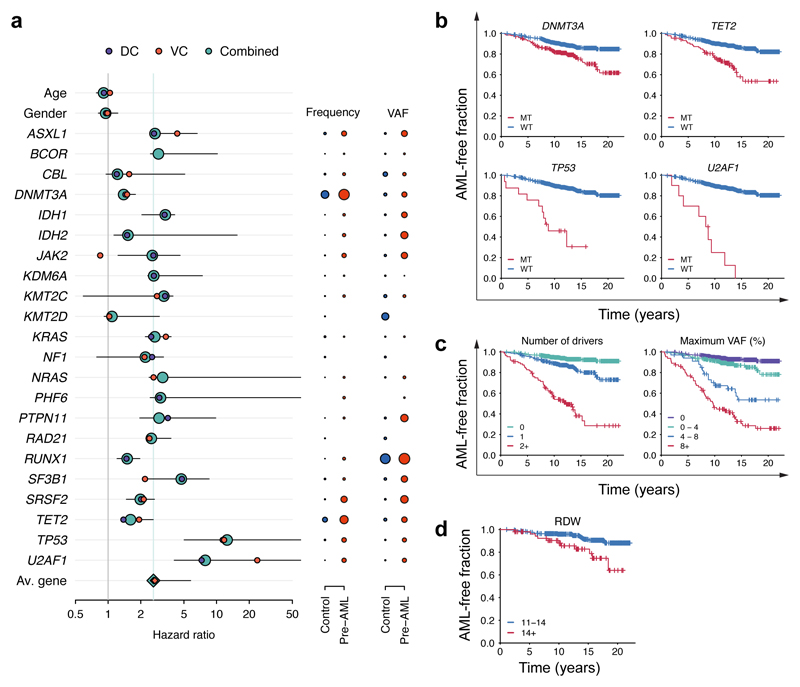
Figure 3. Model of future AML risk.
a, Forest plot of the risk of AML. Purple, orange and green circles indicate hazard ratios and horizontal lines denote 95% confidence intervals for the combined cohort. For each gene, the indicated hazard ratio applies to the AML risk conferred by each 5% increase in mutation VAF over a 10 year period. The green vertical line indicates the mean HR across all genes. The HR for RUNX1 must to be interpreted with caution due to the relatively high prevalence of deleterious germline variants in this gene, which may not be readily distinguishable from somatic mutations in unmatched sequencing assays (see Methods). The proportion of individuals with mutations in each gene and the average VAF are indicated to the right of the forest plot; red and blue circles represent pre-AMLs and controls, respectively, with circle sizes scaled to reflect mutation frequency and VAF. b-d, Kaplan-Meier curves of AML-free survival, defined as the time between sample collection and AML diagnosis, death or last follow-up. Survival curves are stratified according to mutation status in selected genes (b), number of driver mutations per individual and largest clone detected (c) and red cell distribution width (RDW) (d). Panels a-c represent data for n=796 unique individuals and panel d includes n=299 individuals for whom RDW measurements were available.

