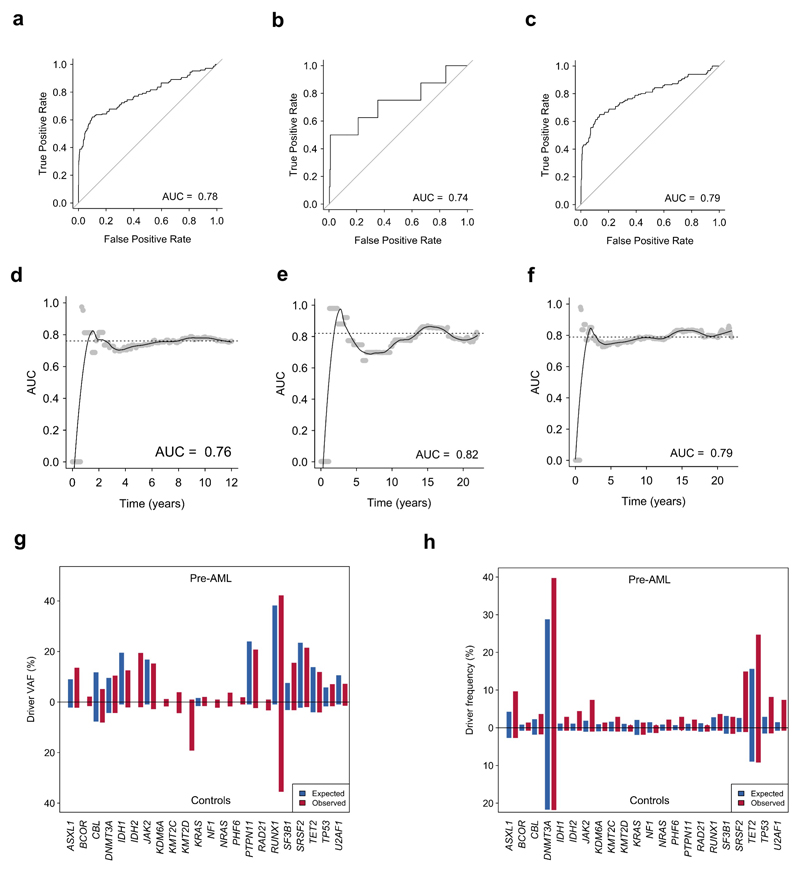
Extended Data Figure 4. AML predictive models.
a,b,c Time-dependent receiver operating characteristic curve for Cox proportional hazards model trained on the DC (a), VC (b) and combined cohorts (c). d,e,f Dynamic AUC for Cox proportional hazards models trained on the DC (d), VC (e) or combined cohort (f). g,h, Red and blue bars indicate the observed and expected VAF (g) and driver frequency (h) for pre-AML cases and controls for each gene indicated on the x-axis. DC, discovery cohort (n = 505 unique individuals); VC, validation cohort (n=291 individuals); ROC, receiver operating characteristic; AUC, area under curve.

