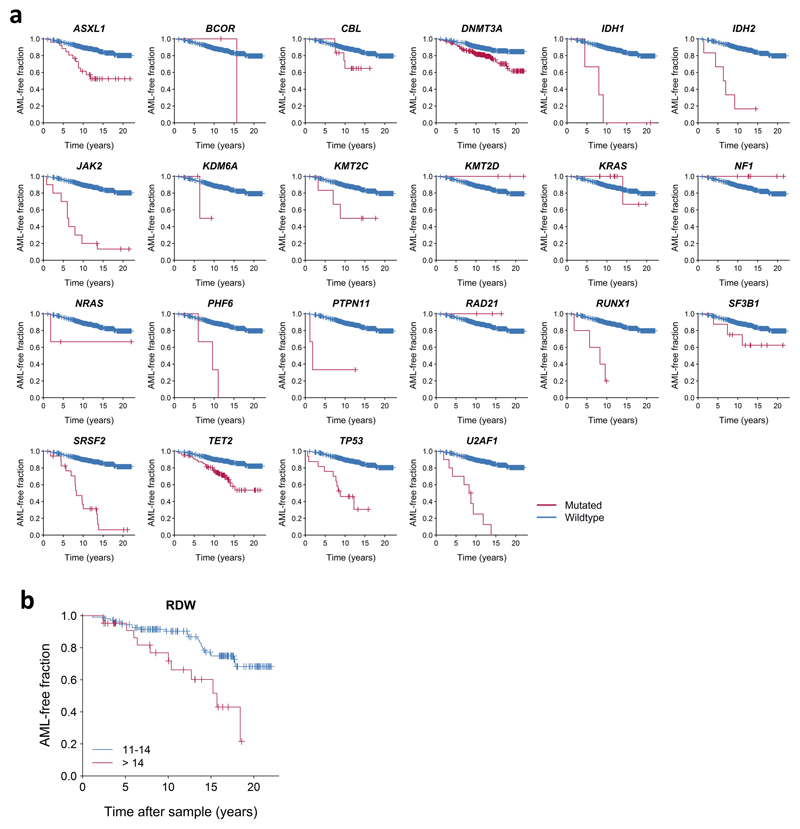
Extended Data Figure 5. AML-free survival according to mutation status and RDW.
a, Kaplan-Meier curves of AML-free survival, defined as the time between sample collection and AML diagnosis, death or last follow-up. Survival curves are stratified according to mutation status in genes mutated in at least 3 samples across the combined validation and discovery cohorts. N=796 unique individuals. b, Kaplan-Meier curve of AML-free survival stratified according to RDW value >14 or ≤14. Plot represents data for N=128 biologically independent individuals with RDW measurements recorded, including all pre-AMLs regardless of ARCH-PD status, and controls with ARCH-PD (controls without detectable mutations omitted). RDW, red cell distribution width.

