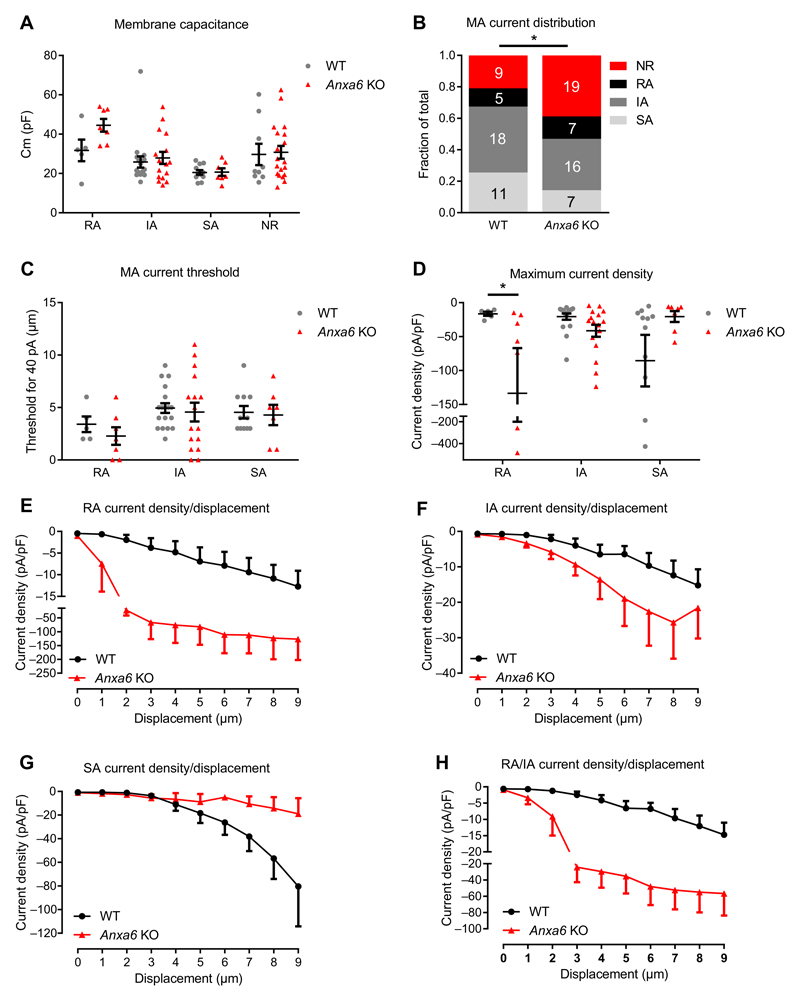
Fig. 2. Mechanotransduction in Anxa6 KO sensory neurons.
Mechanotransduction was assessed in cultured sensory neurons from WT and Anxa6 KO DRGs. (A) Membrane capacitances of recorded WT and Anxa6 KO neurons with RA, IA, or SA mechano-gated current and in nonresponsive (NR) neurons. Cm, membrane capacitance. (B) Distribution of the recorded neurons based on the MA current displayed. (C) Minimal stimulation intensity required to elicit a >40-pA MA current in WT and Anxa6 KO neurons. (D) Maximum current density (Imax/Cm) recorded in WT and Anxa6 KO neurons. (E to H) Current density plotted against the displacement of the mechanical probe for RA (E), IA (F), and SA (G) currents and the merged transient RA/IA currents (H). (A, C, and D) *P < 0.05, WT compared to Anxa6 by two-way analysis of variance (ANOVA) followed by Fisher’s least significant difference (LSD) multiple comparisons test. (B) *P < 0.05 by χ2 test. (C) Two-way ANOVA followed by Sidak P = 0.13, 0.80, and 0.99 for RA, IA, and SA, respectively. (D) Two-way ANOVA followed by Sidak P = 0.046, 0.45, and 0.059 for RA, IA, and SA, respectively. (E to H) Twoway ANOVA P = 0.002, 0.0007, 0.0007, and <0.0001 for RA, IA, SA, and RA/IA, respectively. n values are given in (B) and represent the number of neurons.

