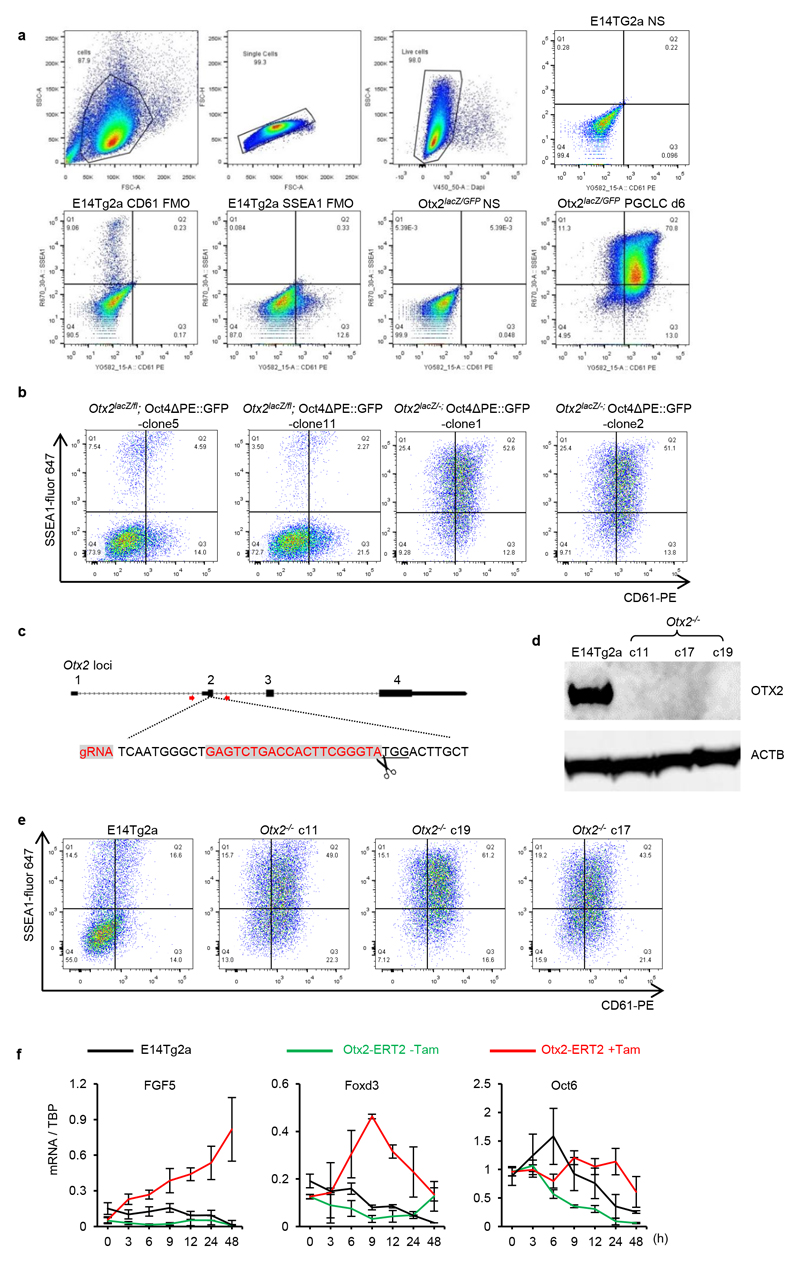
Extended Data Figure 3. Independent Otx2-/- clones show enhanced PGCLC induction efficiency.
a. The gating strategies for analysing PGCLCs by flow cytometry. Cells were first gated based on the FSC (size) and SSC (complexities) scatter plot, followed by selection for singlets based on linear correlations between FSC-area and FSC-height. Live cells were then gated based on exclusion of DAPI to indicate cell membrane integrity. Live cells were then analysed for SSEA1 and CD61. Cells stained for fluorescence minus one (FMO) were used to set gates; stained and non-stained cells are also shown.
b. Otx2lacZ/fl and Otx2 lacZ/- cells with the Oct4ΔPE::GFP reporter (2 independent clones each) were assessed by flow cytometry for surface expression of SSEA1 and CD61 at day6 of PGCLC differentiation. For clone 5 and clone 1, n=2; for clone 11and clone 2, n=9
c. Diagram showing the gRNA sequence (in red) and targeting strategy for generating Otx2 knockout cell lines. Red arrows represent genotyping primers used for screening clones.
d. Immunoblot analysis of OTX2 protein expression in EpiLCs of E14Tg2a and three Otx2-/- clones. Experiment preformed once.
e. E14Tg2a and 3 independent Otx2-/- clones generated by CRISPR/Cas9 were assessed by flow cytometry for surface expression of SSEA1 and CD61 at day 6 of PGCLC differentiation. 2 biologically independent experiments for clone c11, one for clone c17 and c19.
f. Q-RT-PCR of epiblast markers during the time-course outlined in Fig 1b. Expression levels are normalised to TBP; h, hours; Values are means±SD, n= 3 biologically independent replicates.

