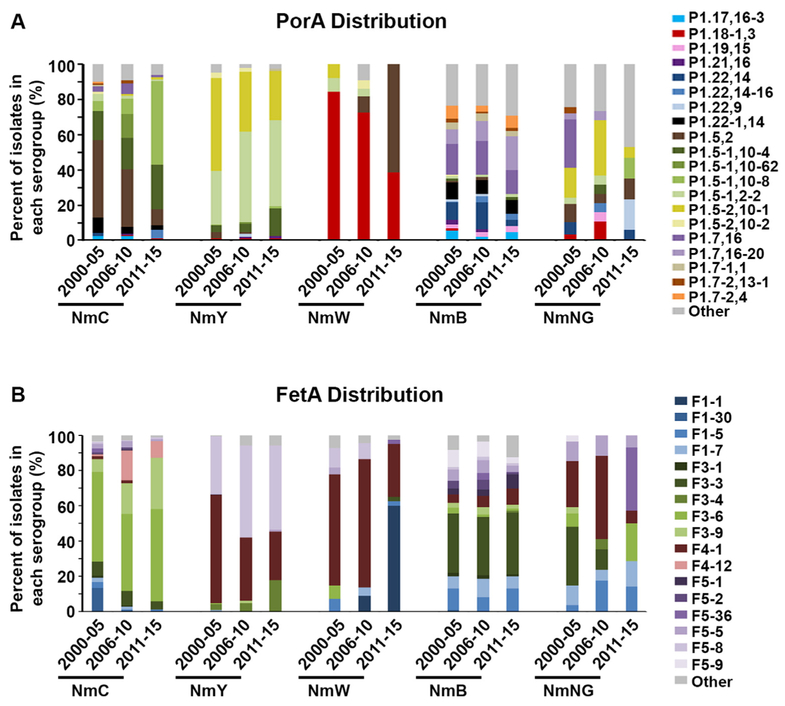
Fig. 2.
Graphical representation of the proportion of isolates associated with each PorA (A) or FetA (B) type. The Other category summarizes PorA or FetA types that were detected in < 10 isolates during 2000–2015 (representing 132 PorA types or 46 FetA types). In the PorA graph, types with the same VR1 region are depicted as multiple shades of the same color (Example: P1.5–1,10–4; P1.5–1,10–62; P1.5–1,10–8; and P1.5–1,2–2 are represented as shades of green). For the FetA graph, closely associated types are depicted as multiple shades of the same color (example: F1–1, F1–30, F1–5, and F1–7 are shown in hues of blue). NmB proportions are represented as OR-corrected values. Results for 2000–05 (17) and 2006–10 (18) were reported previously.

