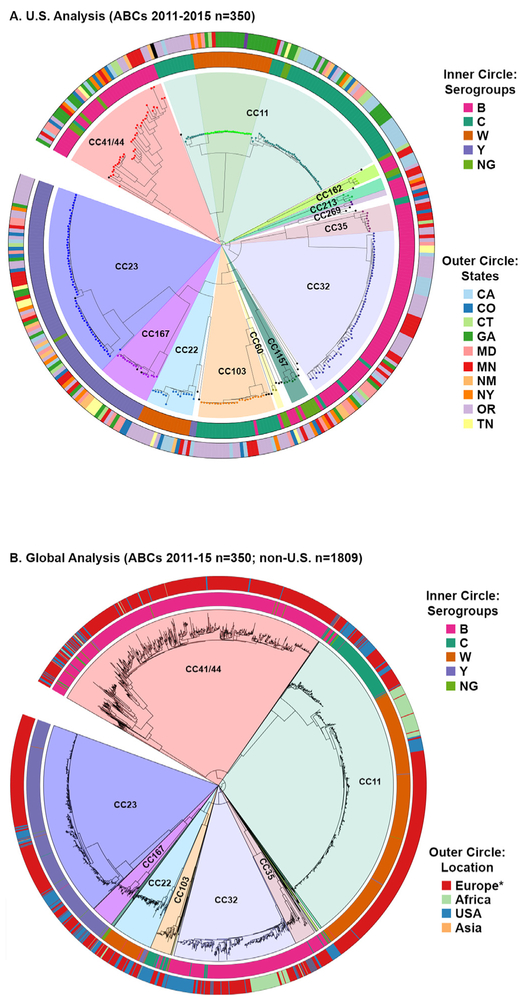
Fig. 3.
Whole genome phylogenies for the (A) 2011–15 U.S. ABCs isolates alone or (B) the combined 2011–15 U.S. and global isolates associated with the main CCs circulating in the United States. Isolates from the same clonal complex cluster together and are highlighted by different colors. The inner circles depict the serogroup for each isolate and the outer circles represent the (A) state or (B) global region where the isolate was collected. *Most of European isolates (94%) are from the United Kingdom.

