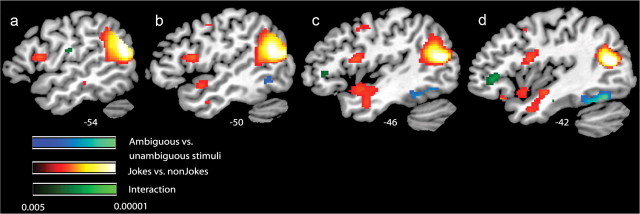
Figure 3.
fMRI response for simple contrasts between jokes and non-jokes (red to yellow), ambiguous and unambiguous stimuli (blue to cyan), and the interaction (black to green). For display, contrasts are thresholded at p < 0.005, uncorrected for whole-brain comparisons for at least 10 consecutive voxels. Activation maps are rendered onto a sagittal canonical T1 brain image.

