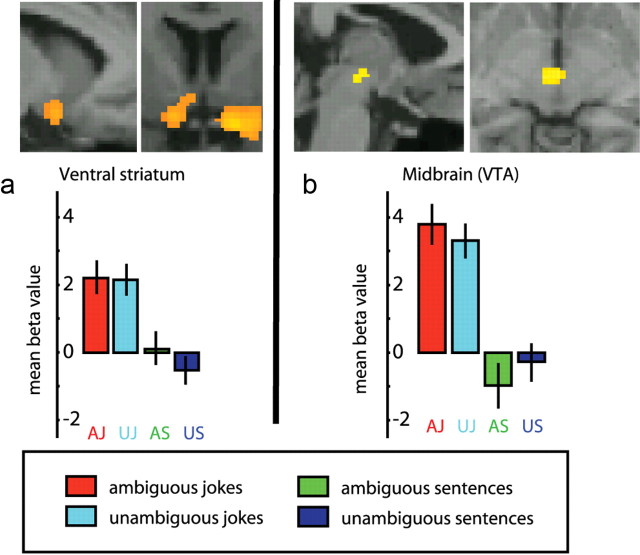
Figure 4.
fMRI response for simple contrast between jokes and non-jokes. a, For display, contrasts are thresholded at p < 0.001 uncorrected for whole-brain comparisons. Activation maps are rendered onto canonical T1 brain images. Top left, Sagittal view of the left ventral striatum activation; Top right, coronal view of the ventral striatum bilaterally spreading to the right amygdala. b, Top left, Sagittal views of midbrain activation; Top right, coronal views of midbrain activation. a, b, Bottom, Beta values (peak voxels for each of the stimuli conditions).

