
7.
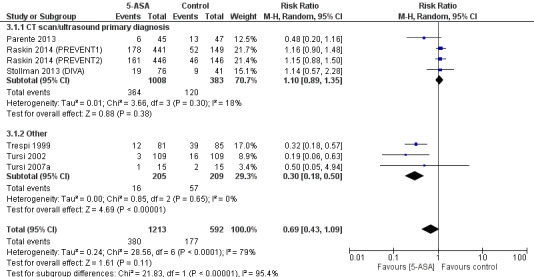
Forest plot of comparison: 3 5‐ASA vs control ‐ subgroups based on method of diagnosis, outcome: 3.1 Recurrence based on CT for initial diagnosis.
Official websites use .gov
A
.gov website belongs to an official
government organization in the United States.
Secure .gov websites use HTTPS
A lock (
) or https:// means you've safely
connected to the .gov website. Share sensitive
information only on official, secure websites.
Forest plot of comparison: 3 5‐ASA vs control ‐ subgroups based on method of diagnosis, outcome: 3.1 Recurrence based on CT for initial diagnosis.