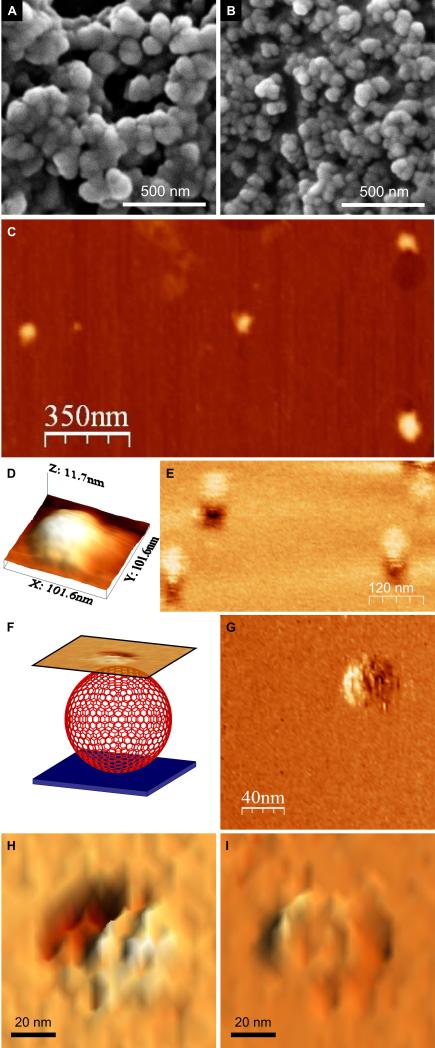
Fig. 3. (A and B) Scanning electron micrographs of the SAGE particles.
(A) Images recorded after mixing hub A and hub B in PBS, pH 7.4 (to final concentrations of 50 μM in each of the component peptides, CC-Tri3—CC-Di-A and CC-Tri3—CC-Di-B, i.e. 16.7 μM of each hub). After 1 h, resuspended material was transferred to a carbon-coated stub and sputter-coated with gold/palladium before imaging. (B) Smaller SAGE particles formed by mixing CC-Tri3—CC-Di-Ai and CC-Tri3—CC-Di-Bi. Full images are provided in Fig. S11. (C – I) Scanning probe microscopy of the SAGEs. (C) Tapping-mode AFM (TM-AFM) scan of 4 individual collapsed SAGEs dried onto a mica substrate. (D) 3D representation of the topography measured over a single collapsed SAGE via TM-AFM. (E) LMFM scan recorded in liquid in a noncontact regime with a constant separation of the tip from the glass substrate. (F) Schematic representation of the LMFM scanning regime. An optical feedback maintained the vertically oriented cantilever at a constant separation from the substrate. Mapping the shear-force interaction nanometers above the SAGE allowed an image to be collected in a non-contact mode. (G – I) LMFM images of the hexagonal ultra-structure on the surfaces of hydrated SAGEs.

