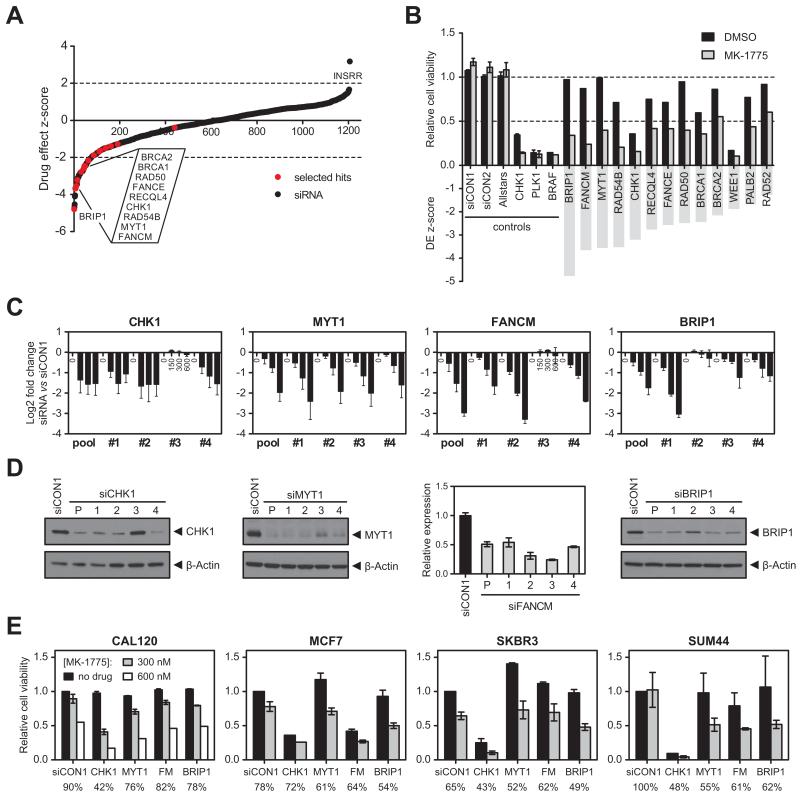
Figure 1. siRNA screen identifies novel determinants of WEE1 inhibitor sensitivity A.
Drug effect Z-scores for an siRNA/MK-1775 WEE1 inhibitor sensitivity screen in WiDr cells. Z-scores <−2 represent statistically significant sensitising effects to 200 nM MK-1775 (dotted line). Black dots, individual siRNA SMARTpools targeting 1206 genes; red dots, hits selected for further validation.
B. Relative cell viability (top) and drug effect (DE) Z-scores (bottom) for selected hits from the siRNA screen after treatment with DMSO (black bars) or MK-1775 (grey bars). siCON1, siCON2 and Allstars were included as non-targeting controls; siCHK1, siPLK1 and siBRAF were included as transfection controls.
C. Sensitisation to MK-1775 was validated with four individual siRNA duplexes targeting CHK1, MYT1, FANCM and BRIP1, or a pool of all four duplexes. At 48 hours post siRNA transfection, WiDr cells were exposed to 150, 300 or 600 nM MK-1775 for 4 days. Log2 fold change in cell viability is shown for each siRNA relative to siCON1.
D. Western blot analysis of cell lysates harvested 72 hours after transfection with siRNAs targeting CHK1, MYT1 and BRIP1. β-Actin was used as loading control. For FANCM, cDNA was prepared from RNA isolated 48 hours after siRNA transfection. FANCM mRNA expression was normalised to GUSB mRNA expression. Error bars represent SEM of three technical replicates.
E. Effect of CHK1, MYT1, FANCM (FM) and BRIP1 siRNAs and siCON1 (non-targeting control) on sensitivity to MK-1775 in breast cell lines CAL120, MCF7, SKBR3 and SUM44. Cell viability (normalised to siCON1-transfected cells without MK-1775) is shown after exposure to 300 or 600 nM MK-1775 for 4 days as determined by CellTiter-Glo. Numbers below the graph indicate cell viability after 300 nM MK-1775 relative to no drug treatment for each siRNA separately. Error bars represent SEM of two independent experiments.

