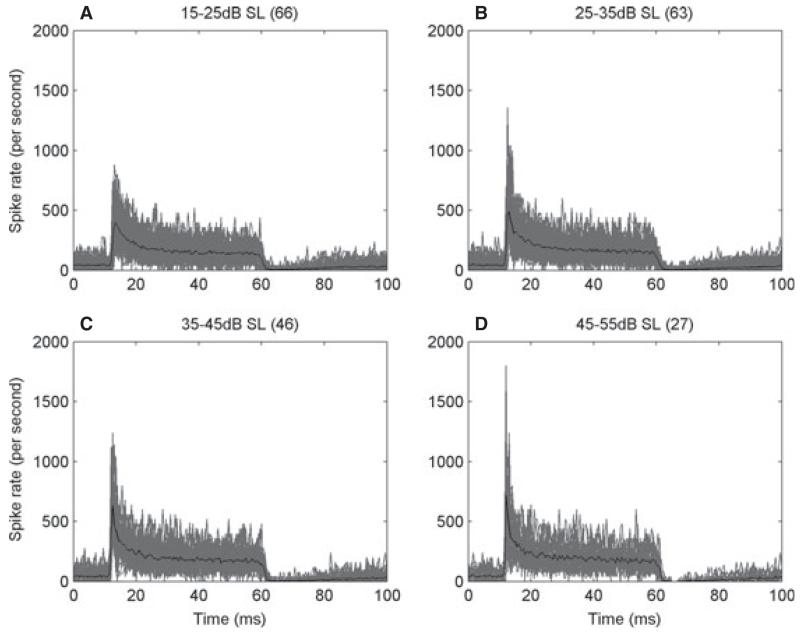
Fig. 6.
Variation in the shape of the PSTH in response to CF tones with sound level above minimum threshold. (A–D) PSTHs at different levels above threshold (shown above the plots) from all fibres (number in parentheses) with CF > 1.5 kHz overplotted (grey). Each individual PSTH is derived by averaging across the levels in a CF rate–level function. The black lines are the mean values.

